

Portables & System 1

Introduction
Most people know of Bently Nevada for the online condition monitoring and protection of the world’s most critical rotating assets. Fewer know that Bently, together with their 2011 acquisition of Commtest Instruments, have a combined experience exceeding 30 years in portable vibration data collectors and analyzers. And some aren’t aware that Bently’s flagship condition monitoring software, System 1, supports not only our critical machinery protection systems but the full portfolio, including portables.
Over those years we’ve received a lot of feedback from portable users, about how they’d really like their devices & software to behave. Here’s a distillation of those requests, along with how we’ve been addressing them. They're grouped into three types, those related to:
1. the data collector/analyzer, 2. setting up a database & routes, 3. analysis and reporting, back in the software.
But first, where do portables fit in?
For anyone who’s not quite sure how portable vibration data collectors are used, here’s a quick primer. These instruments measure machinery vibration, typically via a piezo accelerometer. That sensor is usually temporarily mounted via a magnet, near a bearing on a piece of general industrial machinery, like a pump or a fan. The user is prompted to follow a route around their plant, placing the sensor on each bearing of each machine in turn, and recording the pre-configured measurements. This is typically repeated on a monthly schedule. Note that these are not just overall vibration readings, they are full vibration waveforms, and can be displayed in the frequency domain. i.e. these devices are portable spectrum analyzers. But still, analysis is not normally done at the machine, rather afterwards in the analysis software, System 1.
With the monthly collection schedule, portables are clearly not used for machinery protection, but rather for optimizing maintenance strategies. Instead of performing maintenance (like bearing replacement) on fixed schedules, the condition of the machine is monitored, so it is only repaired when actually required. That usually reduces maintenance costs, but even better, condition monitoring also leads to increased production. That’s due to having fewer unexpected failures, so less unplanned down time.
Within a plant there will be a wide range of machines, from a few critical machines which are central to the plant’s production, through to the many smaller ancillary machines which play supporting roles and are often spared. This later group typically run on rolling element bearings and have relatively slow wear-out mechanisms, so are ideal for monitoring using portable data collectors. A large number can be monitored very cost effectively, compared to installing permanent sensors and online systems.
That covers the very core usage of portables as routine data collectors, but they can do so much more! For example, detailed diagnosis of machines which have just one or two vibration transmitters, which provide 4-20mA overall levels only. Or to re-balance machines. Or to perform sophisticated modal impact testing to find the natural resonances of a machine or its supporting structure…
Related to the data collector/analyzer
“Data collection needs to be really fast!”
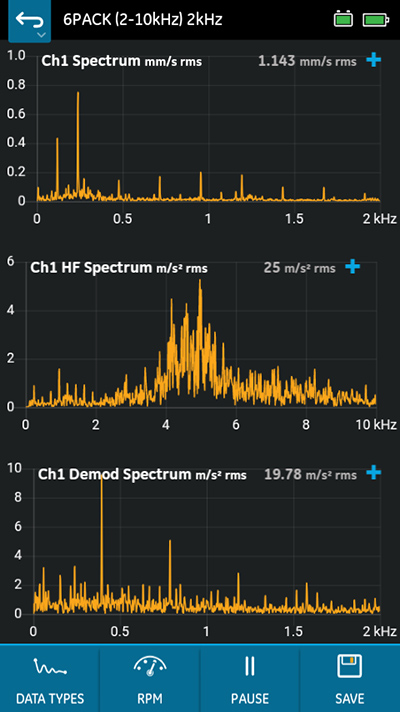
We hear you! When you’re collecting data on a route with say 200 machines, that could easily be 2000 measurement locations. Just a few seconds delay at each location could result in a full hour lost from your day. Our suite of innovations to speed you along began with an automatic settling algorithm, patented in 2006, which minimizes the time needed to settle sensors and velocity integrators. Included in that was the optimized sequencing of recordings, so those needing the most settling are automatically performed last. Then in 2010 came the patented 6Pack measurement. This uses parallel processing to simultaneously generate the three key spectra & three waveforms needed for typical analysis - Velocity, Demodulation & high freq Acceleration. All acquired in the same time as a single Velocity measurement. And if that’s still not fast enough for you, try recording with multiple sensors at the same time. Many of our data collectors support the 6Pack on a triax sensor, recording all six measurements on all three axes simultaneously. An 18Pack. Almost a slab1.
“To analyze our machines, the ______ measurements are critical to us” (fill in the blank with “high resolution” or “low frequency” or “peak based Demodulation/Enveloping” or “Sync sampled / Order tracked” or “time Sync averaged” or “tach triggered” or …)
We’ve got you covered. With Fmax’s from 25 Hz to 80 kHz, spectral resolutions up to 12800 lines, and averaging up to 128 times, all realistic measurement needs are easily met. And yes, Demodulation (Enveloping) is extremely important for the very early detection of lubrication issues and bearing wear. We offer not only a really good digital Demodulation algorithm, but also PeakDemod, which implements the popular technique of a competitor, via their expired patent. Yes, we support all those other measurement types above too, and plenty more. Like Keypad Entry, and of course Orbits.
“In some of our plants the operator skill level isn’t high. It’s got to be easy to use, especially for routine data collection.”
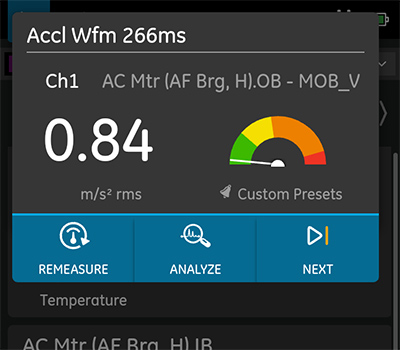
Absolutely! That’s why all our portables give a very clear route display, showing the user where they’re up to, and where to take the next reading. Meanwhile allowing them to skip over machines which aren’t running, and easily delete any mistake readings. They can choose to see just an over-all vibration display rather than spectra, if they prefer. To keep things simple, we don’t even require the use of a computer to get the data back for analysis - our Remote Comms option just needs an ethernet or WiFi network connection from the portable to the server.
“And while you’re at it, what can you do to ensure those operators take good quality data?”
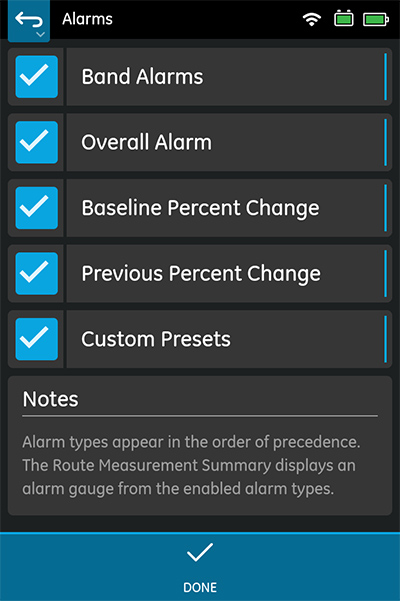
Of course, our portables check to see if a sensor has been connected, by looking for the sensor bias voltage. But we go a lot further than that. Detailed information about each machine’s vibration characteristics can be sent to the portable, from previous and baseline readings, through to complete alarm band settings. Warnings can be enabled in the data collector to alert the operator to an abnormal measurement, with those warnings automatically making use of the most detailed & machine-specific info available.
“The plant has Div 1 / Zone 1 hazardous areas, so I’d really like to use an Intrinsically Safe data collector, instead of needing Hot Work permits. But all the IS portables seem to be low performance versions, with short battery life and reduced specs & channels etc.”
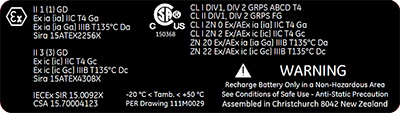
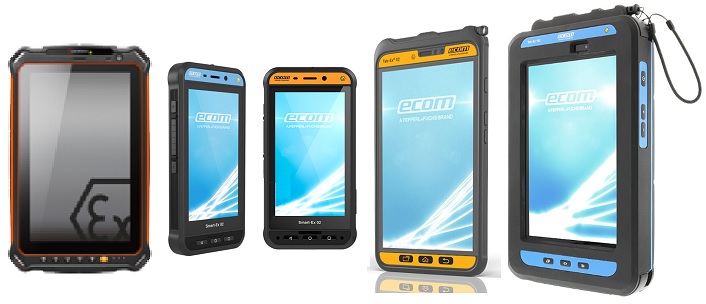
Our Intrinsically Safe data collectors are the SCOUT220IS and 240IS. During development we really focused on a seemingly impossible combination – to attain that highest level of security, while maintaining speed, processing performance, and battery life, yet without adding excess weight. It essentially boiled down to designing very efficient circuitry, providing the myriad of safety controls required, without hogging power from the battery. We’re thrilled with the outcome, our IS versions have all the same impressive performance specs and battery life of their non-rated COMMTEST versions, with only the compromise of ~90g (0.2 lb) extra weight due to encapsulation of the electronics.
“Hey, I need to lug this thing up & down ladders. It’s got to be easy & safe to carry around the plant, hands free. All day.”
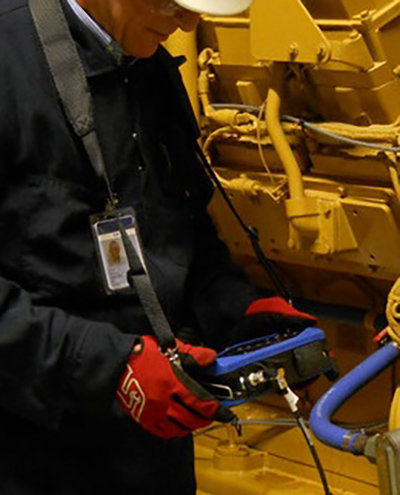
That’s why we designed with lightness in mind, right from the start. In our vbX/SCOUT100 series, we included an innovative strap mechanism which allows the data collector to hang vertically while walking, then rotate into a horizontal position when in use. In the SCOUT200 series we didn’t need that, as the data collector just hangs out of the way, and the industrial smartphones and tablets are so light to carry. But there’s much more. Like a sensor-keeper on the neck-strap, with the sensor held in place by its own magnet, so your hands are free for those handrails and ladders. And while we’re talking safety, we are the ones who introduced the break-free connectors into sensor cables, way back in 1999. So if your sensor gets tangled around a rotating shaft, you don’t get tangled in there with it. But when your life is at stake, why would you stop with one level of protection? So we added carefully-calibrated release rings where your neck-strap attaches to the data collector. Safe and easy to carry. Got it.
“OK, I asked for it to be easy to carry, but it’s also got to be drop & water proof, have a full-day battery life, and have a large clear display (my eyes aren’t getting any younger you know).”
You want it all don’t you? With you in mind, all our portables are subjected to a MIL-spec 4ft (1.2m) drop tests, and an IP65 Ingression Protection test. Most work-shifts are 8 hours, so we set our battery life target at 10 hrs. All our portables exceed that, with ease. Regarding screens, our vbX/SCOUT100 may have a rather dated grey-scale LCD screen, but it’s the transflective type, so has perfect readability from blazing sunlight to complete darkness. And for screen size, our SCOUT200 series gives you complete control over that. Choose a large 8” tablet, or a convenient 5” smartphone. Or have both. And update to newer models whenever they come out.
“Hmmm, collecting data is looking good, but sometimes we need to perform in-situ balancing, or detailed analysis at the machine side.”
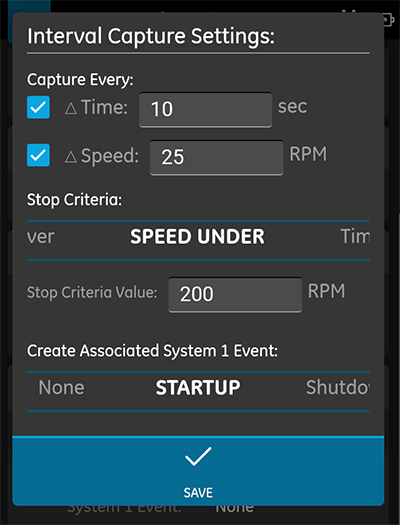
That’s why our range includes balancers and analyzers, in addition to data collectors. Our balancers use the Initial-reading, Trial-reading, Balance-run sequence, support single plane and dual plane correction weights, measure from between 1 & 4 sensors, and provide a full suite of balance calculators (like combining weights and adjusting radius). Light analysis incudes techniques like coast-down run-up (or interval capture, to rapidly collect a series of readings as the machine starts or stops, to look for any resonance behavior), bump testing (again to look for structural resonance issues, but this time by striking the machine, carefully), and Time Synchronous Averaging (to focus on vibration which is synchronous with the turning speed of this machine). More advanced techniques include modal impact testing (a sophisticated form of bump test, using a special hammer which measures the force it applies during each strike), and acquiring data for ODS display (Operating Deflection Shapes visualizes the motion of a machine as it runs). Within our range, we have portables which support all of these techniques.
Related to setting up a database & routes
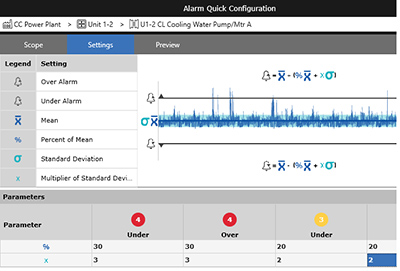
“What measurements should I take on these types of machines? What alarm bands should I look at and what set points should I start with?”
Those are indeed difficult questions. That’s why we embedded a wizard within the System 1 software to answer all three for you. It’s called Quick Config, and it implements the ISO10816-1, -3, -7, & 14694 standards (with amendments) and the Technical Associates Proven Method². To use it you first select the machine type from the pre-built list of machine trains. This will provide you with a nice machine train diagram and allow Quick Config to set up the appropriate measurements and alarms for this machine type. Depending on your selections this provides just overall alarms, or up to 6 band alarms to cover spectral components from sub-synchronous & 1X, up to the higher harmonics of bearing fault frequencies.
“Talking about bearing fault frequencies, does the software know these for the bearings in our machines?”
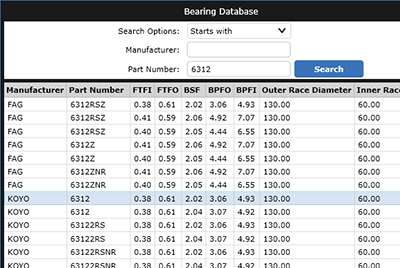
System 1 doesn’t know the fault frequencies for every bearing out there, but we do have a database built in which covers about 30,000 of the most common models, from many manufacturers. For unusual or custom bearings, once you’ve found the fault frequencies from the manufacturer they can be entered manually. And on the subject of fault frequencies, System 1 calculates gearbox meshing frequencies and sidebands for you as well. Even for complex planetary gearboxes.
“Our plant has many pumps & fans of the same types. Can I copy and paste machines to speed up configuration?”
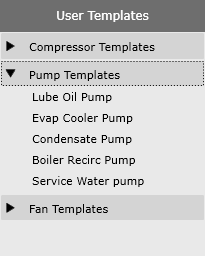
Ha! We can do better than that! Sure, you can make multiple copies of the same machine, but if you decide later that you’d like to make a change (like adjust some alarm settings) you’ll need to make those changes on every machine. Instead we bring you User Template machines, with the power that a change to the template gets automatically replicated to all of its child machines. And yet the flexibility that individual aspects of particular machines can be set differently from the template (e.g. a bearing number). And to support large enterprises, these User Templates can even be shared between databases.
“We’d like to keep a few years of historical data from our previous system. Is that possible?”
This is a really common request. Yes, we can import historical data from a couple of other systems, but certainly not all. As a general guide we recommend this approach: Set up a new databases in System 1, making use of all the nice powerful features in there, like Quick Config, Machine Train Diagrams, User Template Machines, 6Pack measurements, Statistical Alarms etc… Retain historical data within the other system for reference purposes. Once ~1 year of data has been recorded into System 1, the previous historical data should be needed only infrequently.
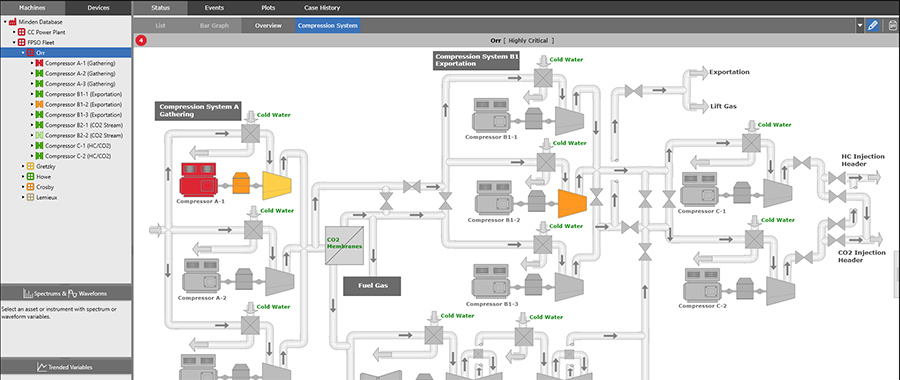
“This one is more of a nice-to-have than a must-have. It would be great to navigate through a graphical layout of the plant, rather than having to scroll through a list of machines names. Especially if they could be color coded by status”
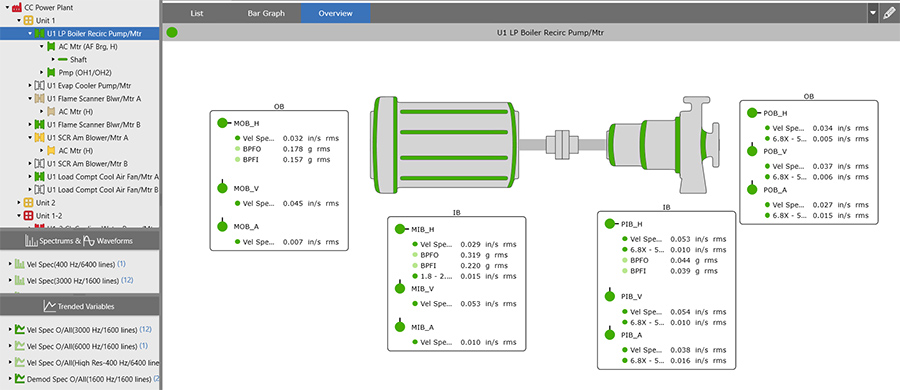
That may not be essential for general machines monitored by portables, but it is really valuable for critical machines monitored online. So, it’s been built into System 1 already. It’s called the Diagnostic HMI, and you can create any plant layout you need. It’s awesome!
Related to analysis & reporting, back in the software
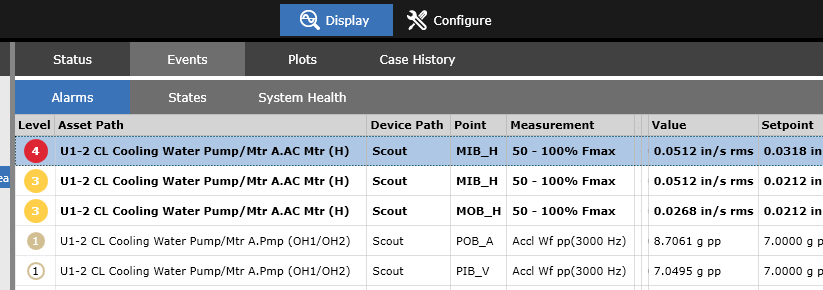
“I don’t have time to look at every spectrum. How does this system help me decide which to focus on?”
We hear you. If you’ve run a route with say 200 machines, that could easily be 2000 measurement locations, with up to 6 spectra/waveforms on each, so about 12,000 data sets to review. You’d go blind or brain dead viewing them all. We don’t want that either, so System 1 does all the alarm checking then allows you to filter to just those machines with serious alarms. Or even better, prioritize your analysis on new Events, so you’re focusing on the recent changes. Double clicking on an item in the Event list takes you straight to a page full of plots, including trends, spectra and waveforms, all focused on the exact alarm transition that the software had detected. Or if you have spare time to analyze machines which have not yet triggered an alarm, use the Percentage Change report to highlight those with increasing vibration.
“For the ones I do need to look at, I’m going to need plots with cursors and fault frequencies & waterfalls & log scales & …”
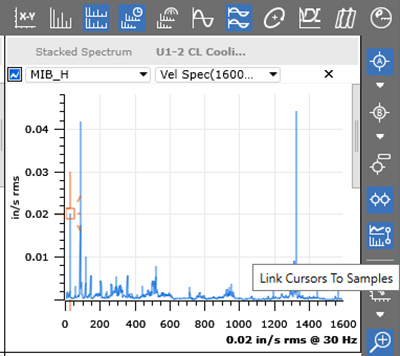
Don’t you worry about that. System 1 has more plot types, and controls for those plots, and readouts to go on those plots, than you can shake a stick at. On top of the ones you asked for, there are also tricks like a peak finder, and really clever synchronizations between spectra & trends, and scales, and cursors. Remember those User Template machines we talked about earlier? You can create specific plot sets for analyzing that type of machines, attach them to the template and they’ll be available for every child machine.
“When I see some really confusing machine behavior, I like to send the data to a smart colleague to see what she thinks it might be. Can I do that with System 1?
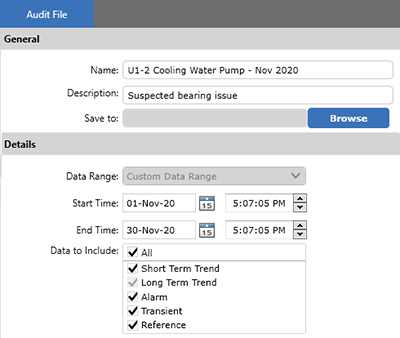
You’re not alone there, plenty of others asked the same thing, so we created Audit files. These contain all the machine configuration info and the data from a selected time range. Your colleague would restore the Audit file into their database and have all the same data to review as you.
“OK, once I’m pretty sure what’s wrong with a machine, I need to report it. Preferably in a way that’s easy, while making me look like a rocket scientist.”
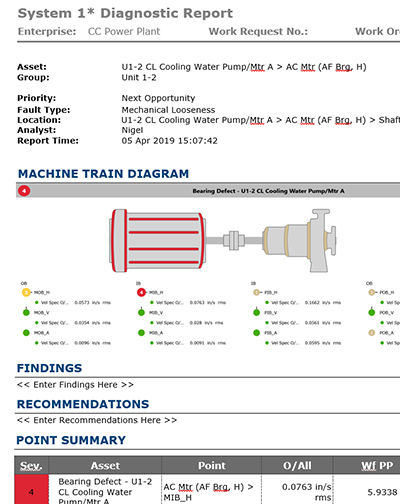
System 1 offers two main ways to do this, one for internal reporting (e.g. within a maintenance department at a plant), the other for external reporting (e.g. for a vibration consultant to provide to a client). The internal version is called a Plot Record, and provides a snapshot of all the trends, spectra & waveforms you consider key to diagnosing the issue, along with text fields to explain the fault and to recommend maintenance. The external version is called a Diagnostic Report, it’s in the form of a professionally formatted Word doc, including all the above plus machine train diagrams and alarm tables.
“Once I get to know a new failure mode of a machine, I like to add alarm bands to detect that fault. But it’s frustrating to have to wait a long time to build up a new set of data.”
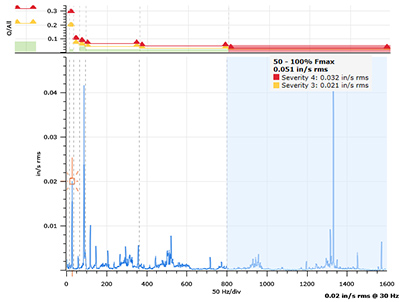
That’s why System 1 not only allows you to add new trended variables to a machine, but it back-calculates those new variables from your historical recordings. So, you can see straight away if your new detection seems to be working. And by the way, those spectral bands can be displayed together with the spectrum which generated them, neatly on the same plot.
“After machines have been running smoothly for a while, I like to fine-tune their alarm thresholds. Can this system help with that?”
That’s a really good idea. But think of the example above of a 200-machine route, with its 12,000 measurements. If each has a few alarms, and each alarm has a couple of threshold levels, you’ll have around 50,000 adjustments to make. Wow! To help out, System 1 has a powerful Statistical Alarm feature built into it. You specify the date range when the machine was known to be running smoothly, plus a few parameters about how tightly the alarms should bound the readings, then System 1 analyzes all those recordings, and proposes newly calculated thresholds.
“There’s some more fine-tuning that some of the headquarters guys want. We’d need to export all the readings for them to analyze. Something about models, machine learning, AI…”
This has been getting popular recently, quickly. Your data is your data, so it’s all available to you. We use a standard for information interchange between computer programs called OPC-UA. This supports not only exporting the trended variables, but also alarms and even complete spectra & waveforms. On an all-you-can-eat basis.
“Oh no, not another piece of complex software to learn!”
It’s true, any software with this much power is bound to have a learning curve. But a lot of effort has been put into making this new iteration of System 1 as intuitive and consistent as possible. And even more importantly, this is the same System 1 that’s being used to monitor your plant’s most critical assets, via online and wireless systems. So, for many plants it’s not really another piece of software - a switch to System 1 for portables means a reduction in software for the teams to learn, to maintain and to license.
Summary

We’ve been listening, we understand your needs. That has led us to our current selection of great portables, all supported by our modern plantwide software. And we aren’t stopping here, we have a strong development program of fantastic new features.
To learn more about Bently Nevada’s line of portable data collectors and System 1 condition monitoring software please use links below or contact your local Bently Nevada sales professional.
References
- Southern-hemisphere humor. See 6Pack and slab.
- Technical Associates Proven Method
Our Experts

Nigel Leigh
Product Line Manager
BIO
Nigel has 20 years’ experience in the vibration analysis and condition monitoring space, having joined Bently Nevada as part of the Commtest acquisition.