

Production Gains in the Pulp Industry Using Wireless Sensors

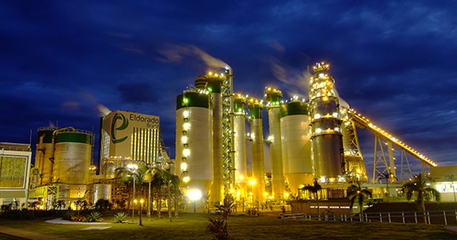
Eldorado Brasil Celulose, a company with an industrial park located in Brazil in the city of Três Lagoas-MS, is the largest single-line kraft pulp industry in the world, with an operating capacity of 1.8M tons of pulp per year, using the most advanced equipment and processes available on the market. Bently Nevada holds a partnership with Eldorado in failure prediction and rotating machine protection technologies.
As a result of this partnership between the parties, a pilot project for proof of concept with the Bently Nevada Wireless Ranger Pro vibration sensor and System 1 Asset Management software was conducted between 11/2019 and 02/2020. Details about the architecture used, analysis resources, as well as two cases of failures identified in equipment during the period will be presented below.
The major differential of the wireless system is the practicality and agility in the installation. With no major infrastructure required for the installation, this brings a great cost-benefit to the project, making it very attractive and competitive.
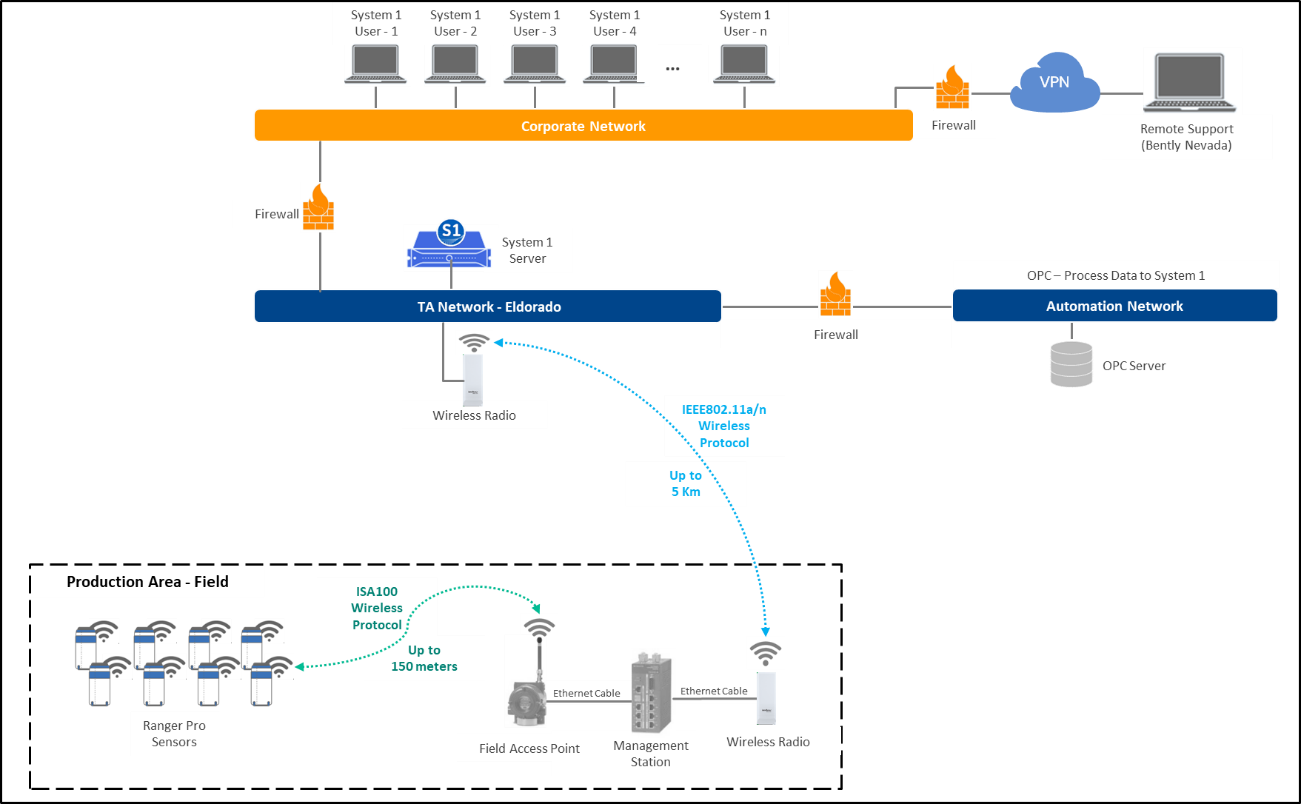
The Ranger Pro sensors, specifically the triaxal model with vibration measurement in the 3 axes X, Y, and Z, and temperature, were installed on the machines selected for the test in the production area and the communication occurred with the Field Device Access Point (FDAP) through the ISA100 industrial protocol (highlighted in green in the figure below). The communication range of this system is about 150 meters between the sensor and the FDAP. All Ranger Pro sensors also have a signal repeater function, which extends the total communication range of the system network. The FDAP is connected to a management station (WDM - Gateway) via conventional network cable (RJ45). It must be emphasized that each management station can receive several FDAP, which increases the system's capacity (total number of sensors).
Both FDAP and management station were installed in the field, and due to the lack of network structure available on site, a communication radio with IEEE 802.11a/n standard protocol (highlighted in blue in the figure below) was used as a bridge between both networks, in this case between the field network and Eldorado TA network, where the System 1 software server is located. This type of solution can, depending on the radio model and antenna type selected, reach a communication range of kilometers.
It must be emphasized that this communication architecture worked perfectly well during the whole period under review, and there was no data loss.
The access to the collected data was done through the System 1 software installed in the computers of the users connected to Eldorado's corporate network. Besides the local access (in the plant), you can also do remote access through the company’s VPN. Remote access via VPN was also made available to the Bently Nevada team for technical support during the period.
This network architecture is presented below for a better understanding:
The condition monitoring software System 1 has been configured with all key parameters necessary for proper fault prediction of the monitored equipment. Basically, this includes machine speed information, bearing models (and the corresponding failure frequencies), waveform and spectra collection parameters (Fmax, resolution lines, collection rate, etc.) and an intelligent notification and alarming plan by automatically sending e-mails to the people responsible for the equipment when an abnormal condition is identified.
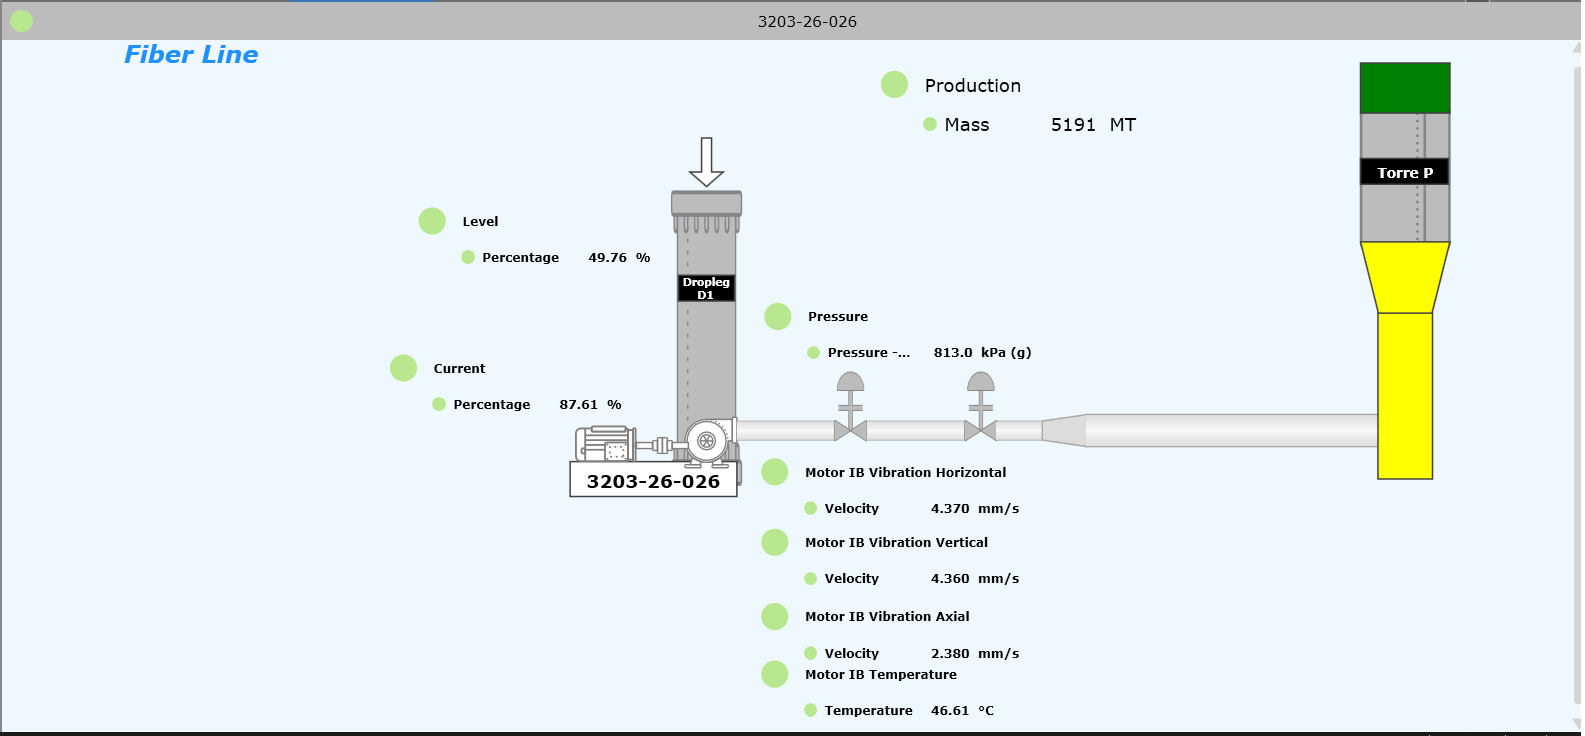
Another important point was the integration of other (process) parameters already monitored in the same equipment, such as motor current, pump flow, production, etc. through the OPC protocol provided by an Eldorado data server. With a more holistic view of information, it was possible to build specific human-machine interface (HMI) screens to simplify the data visualization and fault analysis. An example of this HMI is shown in the following figure, where it is possible to see the pump working with slurry between the whitening stages, containing data of motor current, level, unit production, and the Ranger Pro vibration data.
The equipment has the function of separating undesirable materials in the fiber, and the potential impact with the loss of function in cases of failure is the shutdown of a purge line, reducing pulp production in the plant by 110t/h.
Motor technical data:
- Power: 710kW
- Voltage: 660V
- Speed: 1938 RPM
- Model: HGF 450
- Bearings: Rolling-element Bearing
On 01/20/2020 the motor presented an exponential evolution in the vibration levels of the NDE bearing (Non-Drive End Bearing) with symptoms of mechanical clearance. Upon detection of a failure in a routine inspection, the Ranger Pro wireless sensor was installed to monitor the failure online, with much shorter collection intervals than the usual.
Already at dawn on 01/22/2020, the System 1 alarm management system identified an abnormal condition and automatically sent an e-mail to the maintenance team (at 5:11 am), warning the motor had reached critical vibration levels. See the picture below with the information sent by e-mail.
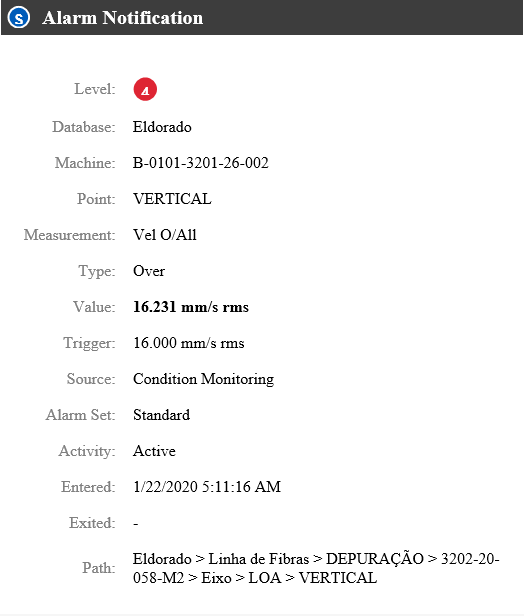
With this information, the managers were able to anticipate their actions for the replacement of the motor, in a scheduled way, performing the operational balance of the production area so that the operational flow of the plant was not greatly disturbed.
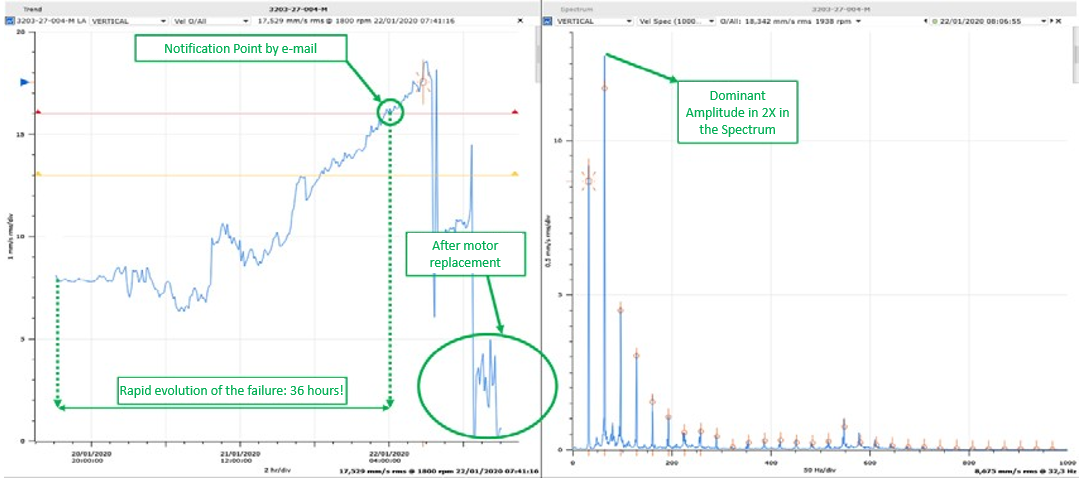
The trend plot (on the left) presented in figure 6 below shows the evolution of the vibration values in velocity (rms) exponentially. Analyzing the spectrum (right plot), we can see that the motor has a mechanical clearance characteristic.
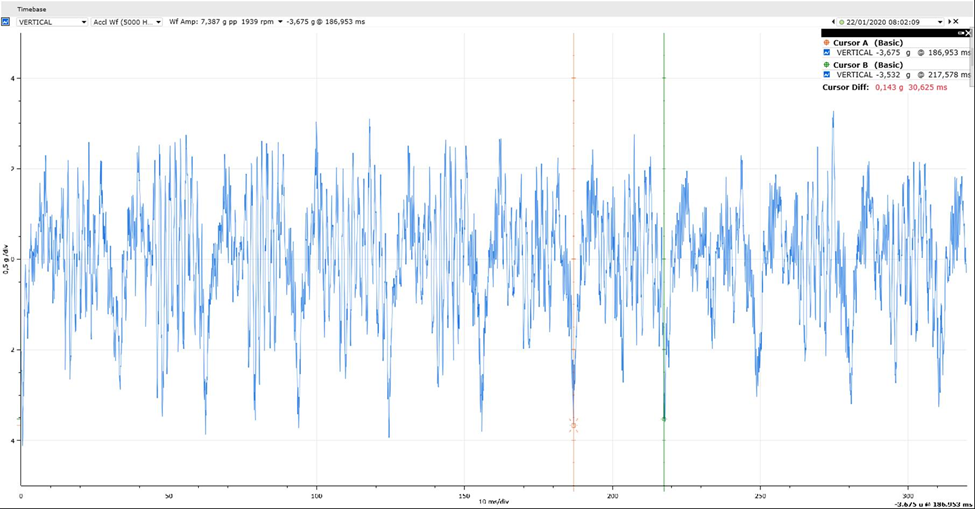
The acceleration time waveform signal, shown in figure 7 below, shows peaks (impacts) with spacing in time (ms) at the fundamental frequency of the motor, characteristic of mechanical clearance.
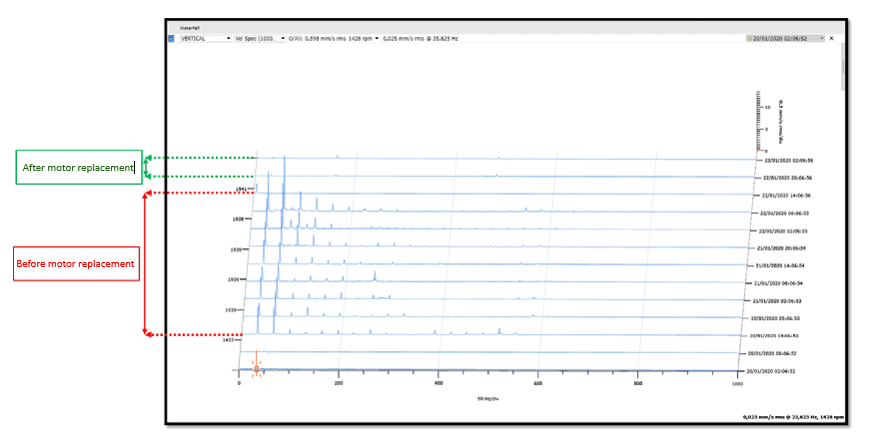
The Waterfall plot (time spectrum) of figure 8 below shows the absence of harmonic peaks defined by the failure after motor replacement.
This case shows the importance to collect dynamic vibration data (waveforms and spectrum) to determine equipment failure.
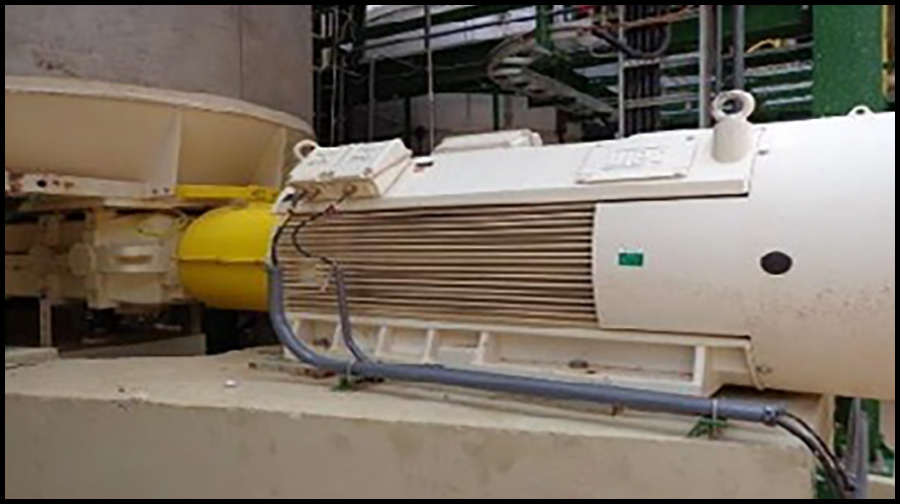
During motor maintenance, the failure identified in the analysis was confirmed. The lubricant seal cap of the bearing touched the shaft due to increased motor clearance, causing severe heating.
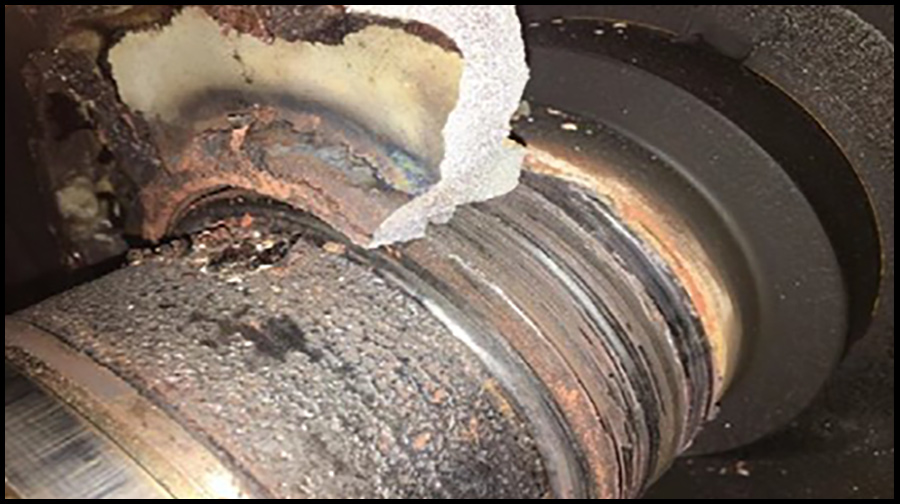
With this heating, the sealing cap had to be broken (figure 9) to be removed and replaced with a new one.
If the Eldorado maintenance team had not acted quickly, damage to the motor (rotor and other internal parts) would have been detrimental, which would have caused an increase in the repair cost, as well as the time needed to return the motor into operation negatively impacting plant operation availability index.
Due to all the data availability, early notification, and diagnostics from the system, actions were taken such that maintenance was planned and performed, timely. As a result, the loss of 440 ton of pulp production was avoided. Considering an average of $ 684 US Dollars per ton of pulp in January 2020, the saving was about $ 300,000 US Dollars.
The equipment function is to adjust the consistency and cool the pulp in the digester discharge. The potential impact with the loss of the asset function due to a failure is the interruption of the digester production, whereby causing a loss of 229 t/h in pulp production.
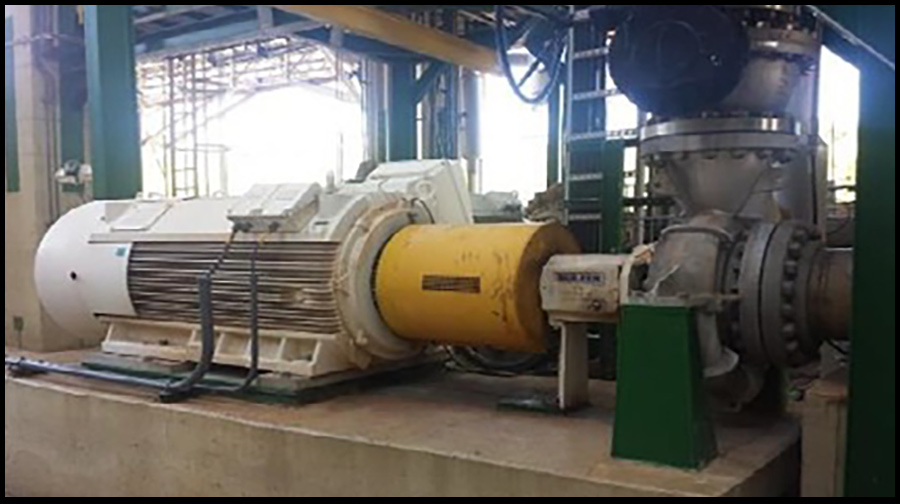
Technical data:
- Power: 670kW
- Voltage: 660V
- Speed: 1800 RPM
- Model: HGF 450
- Bearings: Rolling-element Bearing
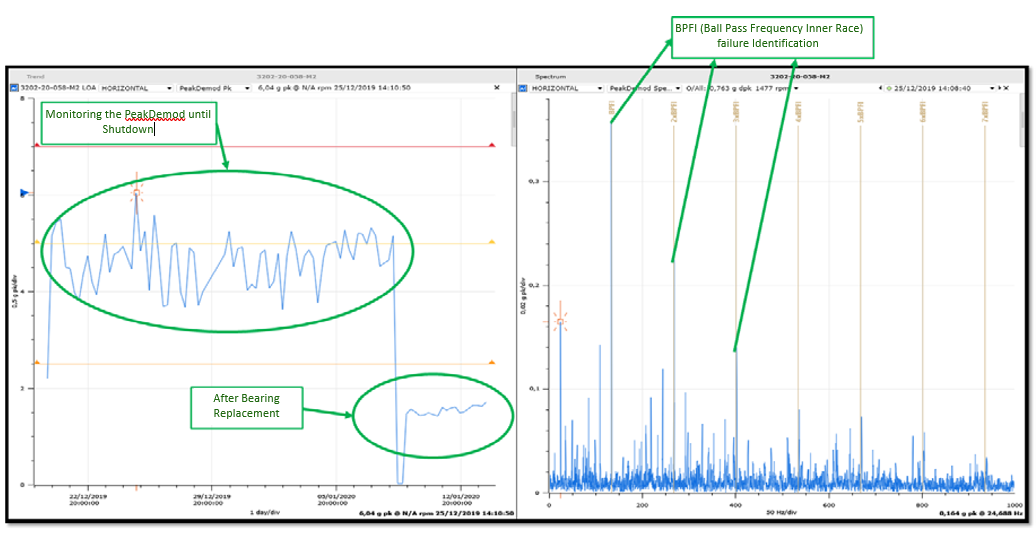
On 12/21/2019 the motor presented an evolution in the PeakDemod (Peak) vibration levels, with symptoms of BPFI (Ball Pass Frequency Inner Race) failure in the bearing on the opposite side of the coupling (NDE).
The PeakDemod is an algorithm present in wireless Ranger Pro sensor that demodulates the high vibration frequency signals, allowing early identification of rolling element bearing failures.
The operation team of this unit had a shutdown scheduled for 01/09/2020, and the challenge for the Asset Monitoring Center (AMC) team was to follow up and find ways to mitigate the effect of the failure until the scheduled shutdown date. This is a classic example of predictive asset maintenance.
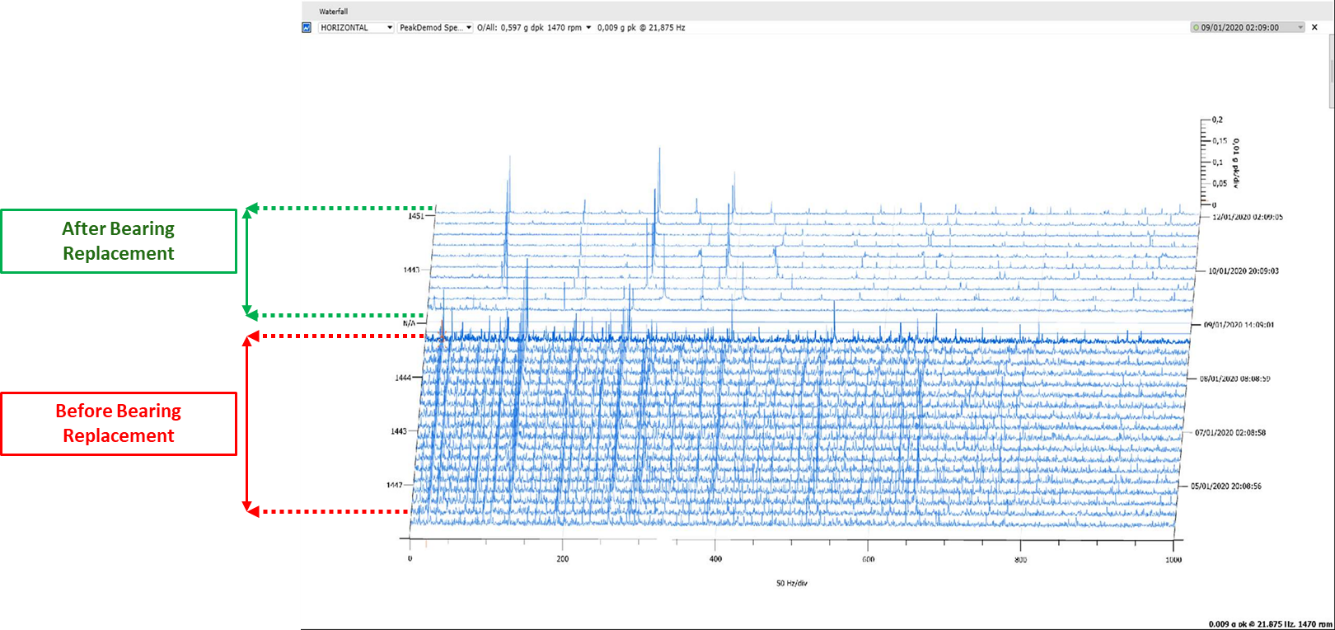
In the plots of figure 11 below, you can notice the PeakDemod variable tracking from 12/22/2019 until the day of the programmed shutdown on 01/09/2020 (trend plot - left), as well as the behavior of the variable after bearing replacement. The right plot shows the spectrum in PeakDemod where it clearly indicates the dominant amplitudes in the frequency of internal track failure (and its harmonics) of this bearing on 12/25/2019.
The Ranger Pro sensor was used to track the evolution of the failure and to make decisions on actions to mitigate the effect of the failure, such as, occasional lubrication on this bearing.
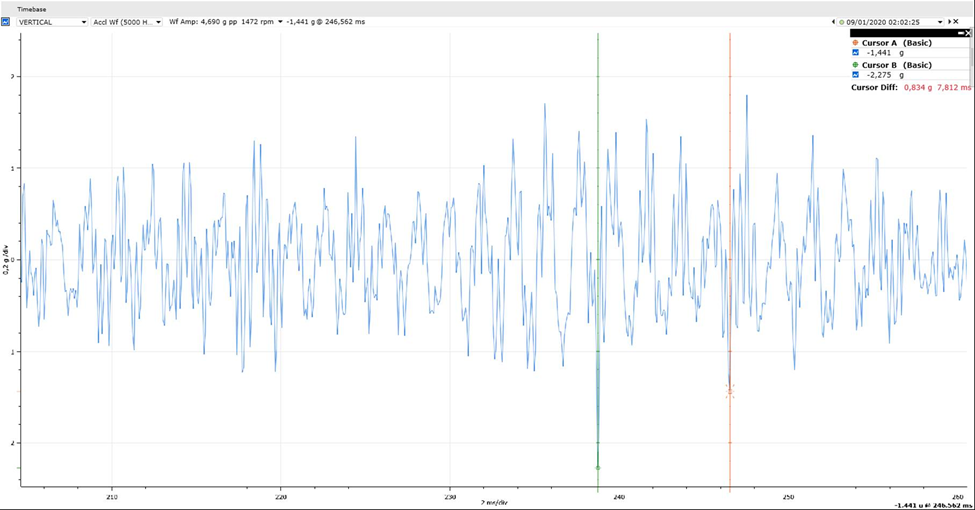
The plot in figure 12 below shows the acceleration waveform, displaying impacts on the BPFI (Ball Pass Frequency Inner Race) failure frequency. Note that the time difference between the impacts (green and orange) is 7.812 ms which corresponds to a frequency of approximately 128 Hz, corresponding exactly to the inner race failure of this bearing.
The Waterfall plot in figure 13 shows the energy drop from the impacts after the motor bearing was replaced.
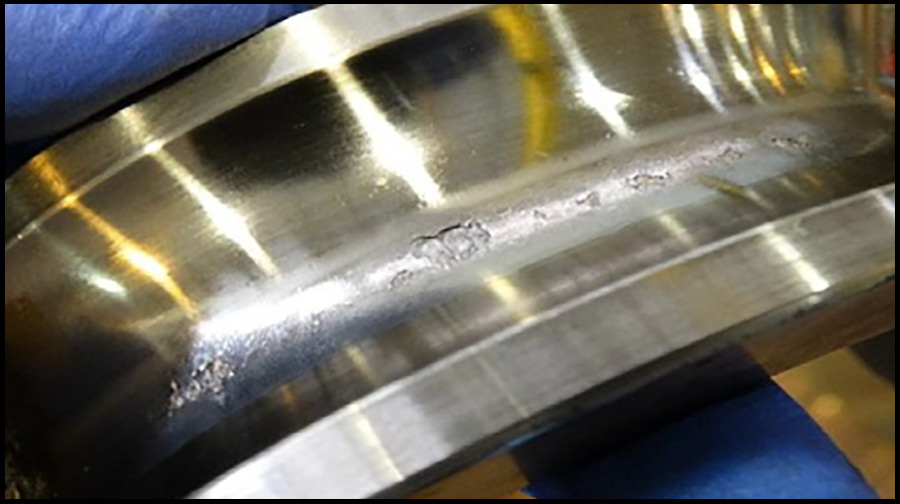
After the motor maintenance, the bearing was analyzed by the Eldorado’s team of bearing specialists, evidencing the failure in the bearing inner race, as figure 14 shows below.
This failure was on-line tracked until the day of scheduled maintenance, thus avoiding the need for emergency maintenance and the loss of about 2,740 tons of pulp production. Considering an average of $684.00 US Dollars per ton of pulp in January 2020, the saving was about $1,874,000 US Dollars.
Online condition monitoring system brings huge returns in terms of reduced maintenance costs and production losses due to unscheduled failures (and shutdowns). The Ranger Pro Wireless monitoring system used in this project proved to be an excellent option. It is easy and fast to be implemented, and it does not require a large assembly infrastructure, and has excellent features including dynamic data for diagnostics of failures in System 1 software.
Even in a short time, it was possible to notice the efficiency of the system in supporting the maintenance team at critical moments with the two very significant cases presented in this article.
Our Experts

Rone de Oliveira Silva
Maintenance Specialist
BIO
Rone has thirteen years of experience in Mechanical Maintenance, from which eight were dedicated to Predictive Maintenance. He is a Maintenance Specialist at Eldorado Brasil.