

Throwback (Sept 1999): Pump Lab is Increasing Understanding of Pump Behavior
Fierce competition is creating intense cost reduction pressures for many of our customers. This is especially true for the oil, gas, and power industries where economic conditions are forcing companies to improve business returns from existing facilities or face the prospect of having to shut them down. Efforts to manage turbomachinery - once the primary focus of machinery protection and management efforts - have given way to intensified programs addressing less critical, rolling element bearing (REB) machinery.
Bently Nevada is recognized as an industry leader in providing solutions for protecting and managing fluid film bearing turbomachinery. However, Bently Nevada has also been successfully managing smaller, rolling element bearing machinery for many years. In fact, our Machinery Diagnostics and Machinery Management Services organizations regularly help our customers manage this type of machinery. In addition, we have an in-house pump lab to further our understanding of pump behavior.
As a result of industry's changing needs, Bently Nevada launched a project in April 1998 to build a pump laboratory and begin in-house research into the behavior of pumps, pumping systems, and low-cost condition monitoring solutions. The primary objective of this research is to determine the most effective measurements for managing rolling element bearing machinery, especially pumps. Our research is based on sound engineering principles rather than rules-of-thumb, or on the presumed ease of making a reliable casing seismic vibration measurement.
A second objective is to provide research support for our Machinery Management Services Engineers. On a daily basis, these engineers encounter and solve pump and other rolling element bearing machinery problems. This includes work with OEMs and end-users. Unfortunately, the plant environment provides limited flexibility to investigate and understand some types of problems. However, a combined effort enables us to validate in the field what we are discovering in the laboratory. The pump lab is helping us understand the fundamental engineering principles and develop cost-effective machinery management solutions.
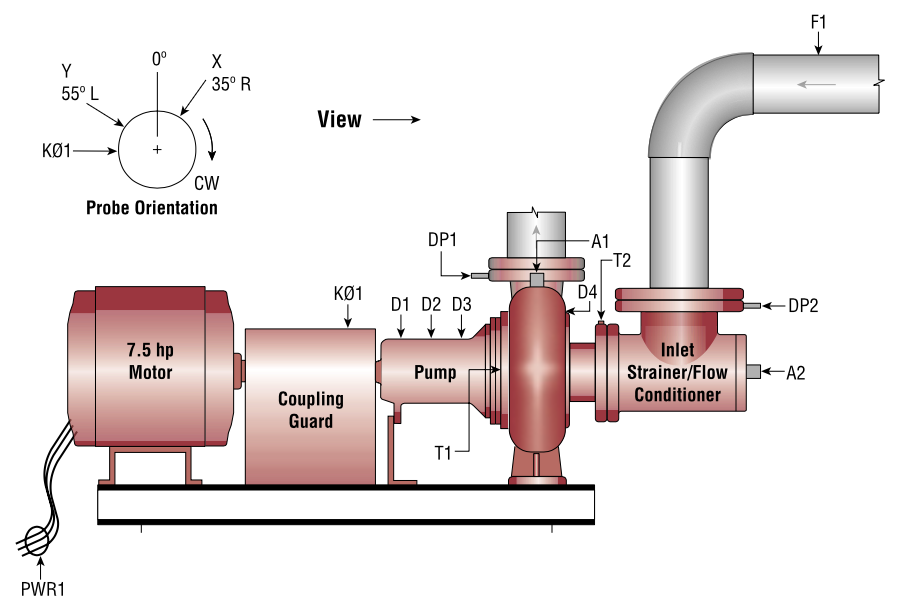
Figure 1 shows the first pump installed, instrumented, and tested in the pump laboratory. The pump, a 4x3x7.5 single volute, overhung design with a 5-vane enclosed impeller, is driven by a 7.5 hp motor. The best efficiency point (BEP) is 14.5 m (47.5 ft) @ 21 L/s (330 gpm) at 1770 rpm. The impeller and shaft are supported by two rolling element bearings and are coupled to the motor with a rather soft coupling. The motor can be driven directly from the power line at 480 V and 60 Hz or from a 480 V variable frequency drive.
The pump loop is supplied with water from a 6000 liter (1600 gallon) tank. The water level of the tank is typically 2 metres (6.5 feet) above the pump inlet. The water is supplied through a 152 mm (6 in) manifold to each of three pump pedestals. Two pedestals can support a 40 hp pump installation, and the third pedestal can support a 20 hp pump. The loop can support up to a 50 L/s (800 gpm) pumping rate. The pumps can be connected either in parallel, series, or a series-parallel combination.
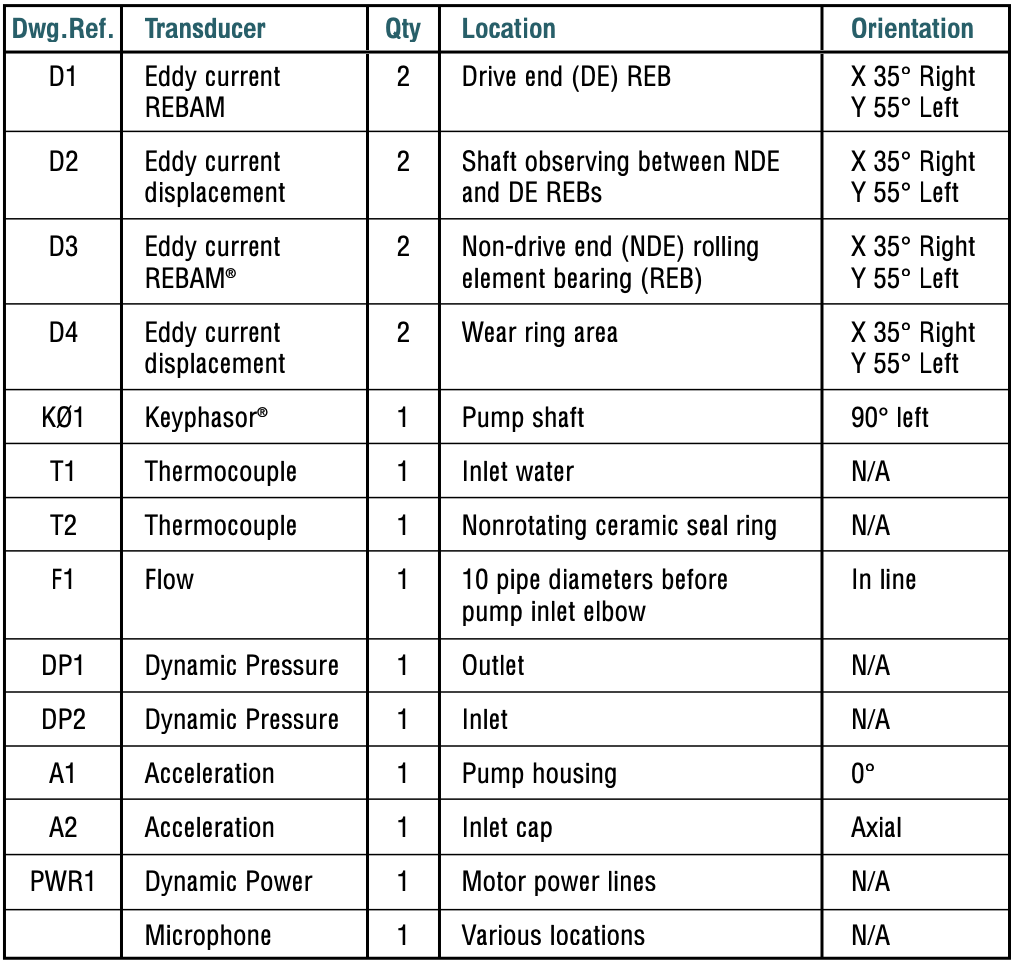
To provide the required visibility into the pumps performance and condition, the pump was fitted with 17 transducers. The transducer locations are indicated in Figure 2 and Table 1.
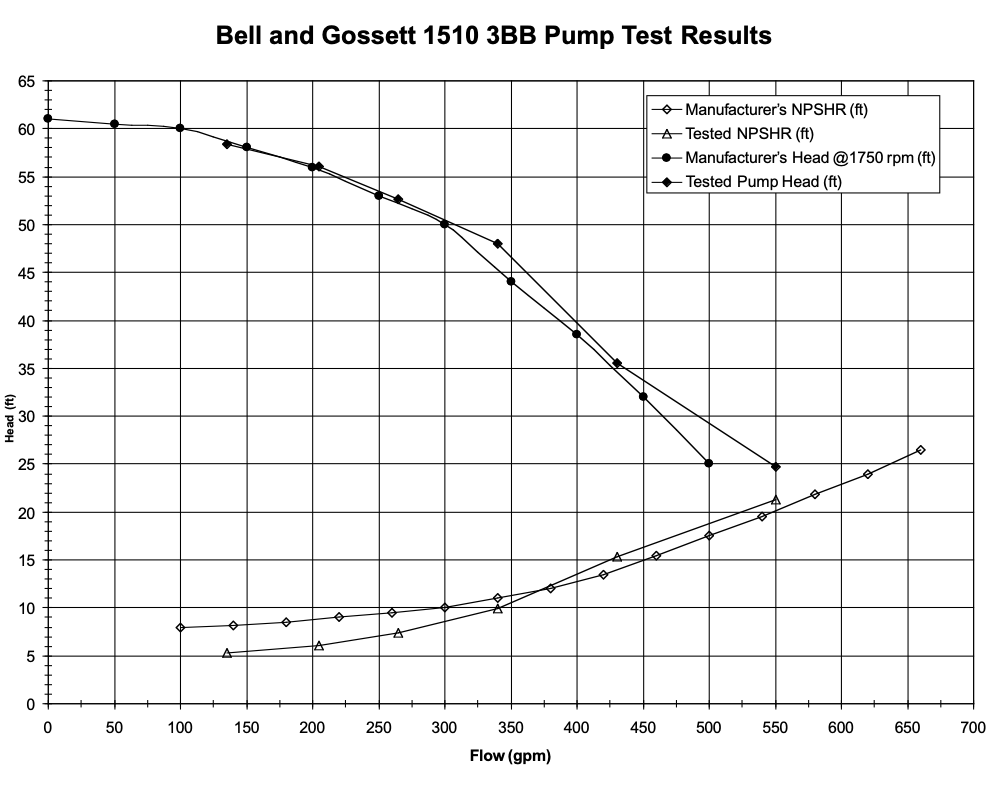
When the pump loop became operational in September 1998, the first test was to verify the manufacturer's head curve data. This ensured that the loop design did not cause the pump to operate outside its design parameters. This test also reproduced the NPSHr (Net Positive Suction Head required) curve for the pump. These test results agree with the stated manufacturer's data reasonably well (Figure 3). During this testing, baseline data was gathered from all of the pump and process transducers.
The next test was to reduce the NPSHa (Net Positive Suction Head available) and observe the changes in the baseline data under conditions of cavitation and reduced flow. The conditions for the onset of cavitation, as defined by the Hydraulic Institute Standards, are a 3% drop in head (NPSHa) while operating at a constant flow, no inlet or discharge throttling. These conditions are established by creating a closed pumping system, operating at a fixed flow rate, and then reducing the inlet pressure on the closed system by drawing a vacuum on the loop.
The first observation was that there was no change in the pump's audible frequency emissions when cavitation occurred. We expected to hear sounds "like marbles are inside the pump." However, as the NPSHa was reduced, there was no audible indication. According to the Pump Handbook [1], "A steady crackling noise in and around the pump suction indicates cavitation. A random crackling noise with high-intensity knocks indicates suction recirculation rather than cavitation from inadequate NPSH." The Pump Handbook also mentions that the noise due to recirculation is louder. This information confirmed our observations.
Our research on centrifugal pump behavior involves taking measurements of vibration, bearing temperature, lubrication condition, and process parameters. These measurements are made at various locations on the motors and pumps to identify and correlate specific operating, vibration, and process conditions. This allows us to assess the effectiveness of different measurements (including dynamic power), transducers, and measurement locations for both machinery protection and machinery diagnostic purposes.
As expected, the most direct measurements provided the strongest signals and clearest picture of the pump's operating condition. Measurements, such as dynamic pressure, direct shaft displacement, and REBAM provide clear and low noise signals, while indirect measurements, such as casing acceleration and acoustic microphone data, are generally more difficult to interpret. In combination, a good picture of the pump's operation is obtained. Our challenge is to determine the best practices for the given machine and operating environment that will provide effective machinery management.
1. Pump Handbook, Second Edition, Karassik, Krutzsch, Fraser, Messina, McGraw Hill, 1986.