

System 1 Use Case: Turbomachinery Monitoring

Introduction
Process-intensive Industrial Operators are increasingly wading into the Digital Transformation revolution to streamline production in the face of globalization, a shifting workforce, and heightened cyber security threats. Delivering safe, reliable, and environmentally friendly operations while maintaining a competitive advantage over peers is virtually unachievable without intelligent adoption of technology and cultural acceptance of changes to long standing processes.
Bently Nevada has been partnering with customers to help solve these challenges. Through user research in 25 countries with more than 500 end users, we have studied our customers’ team dynamics, site processes, and technology suites to determine how System 1 can best support Plant-Wide Machinery Management. The resulting platform meets a variety of unique customer use cases, with each use case leveraging a subset of System 1’s Connectivity, Analytics, and Visualization capabilities. This Orbit Article explores the Turbomachinery Monitoring use case and the application of System 1 for proactive, real-time, and reactive monitoring of this highly critical asset class.
Challenge
Turbomachinery is often the most-critical rotating equipment within an industrial process. As such, this machine class has been instrumented and monitored as part of Condition Monitoring Programs for decades. Bently Nevada’s System 1 Classic, with its rich set of tools for real-time and reactive vibration monitoring, has long been considered the best-in-class turbomachinery diagnostics application and is an essential tool for many industrial operators around the globe.
However, digital transformation has driven operators to seek out a single condition monitoring application that extends beyond vibration and real-time monitoring. They ask:
- How can we establish operating context for turbomachinery by combining vibration, process, and control system data within a single application?
- How can we consolidate our toolset to monitor and manage turbomachines alongside our other operating equipment?
- How can we parse through our rich (and overwhelming) data set to extract insights to proactively detect evolving machine conditions?
- How can we supplement a retiring, expert workforce to ensure that we maintain and improve upon our operating efficiency?
System 1 Solution
System 1 Evo, the next generation System 1 offering, has maintained the deep diagnostic capability-set that made System 1 Classic so essential to monitoring turbomachinery. However, it has been greatly enhanced to meet the evolving digital transformation needs of our customers.
Today, System 1 has broadened its focus beyond its previously narrow “vibration” view and includes external interfaces for importing process and control system data, allowing users to have a comprehensive view of their turbomachinery health. The parallel evolution of Bently Nevada’s plant-wide hardware offerings, such as Ranger Pro and SCOUT, ensures that the solution connects to and visualizes data for all Plant-Wide assets, providing health data on the supporting equipment within the industrial process.
Decision Support provides the analytic engine that parses the vast amount of vibration, process, and other operational data to extract insights and optimize work prioritization and asset management. The engine taps into the rich plant-wide historian of System 1, processes the data through a series of user-defined rules or Bently-defined Decision Support Analytics, and returns the results to System 1 for notification, visualization, and confirmation.
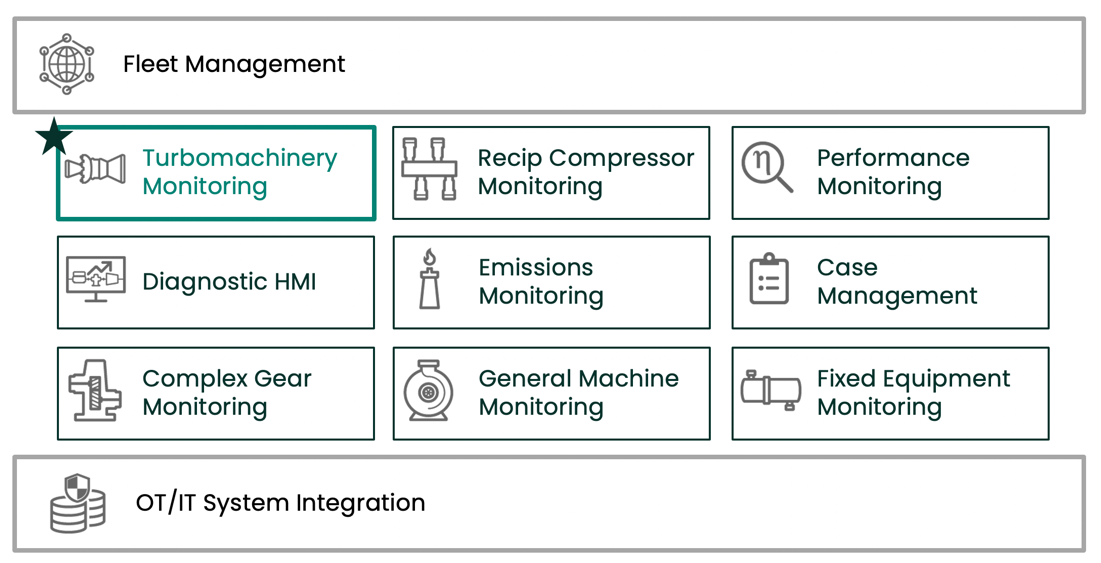
The System 1 Connectivity, Analytics, and Visualization capabilities that support Turbomachinery Monitoring and Management are detailed in the following sections.
Pillar 1: Connectivity
Machinery Definition
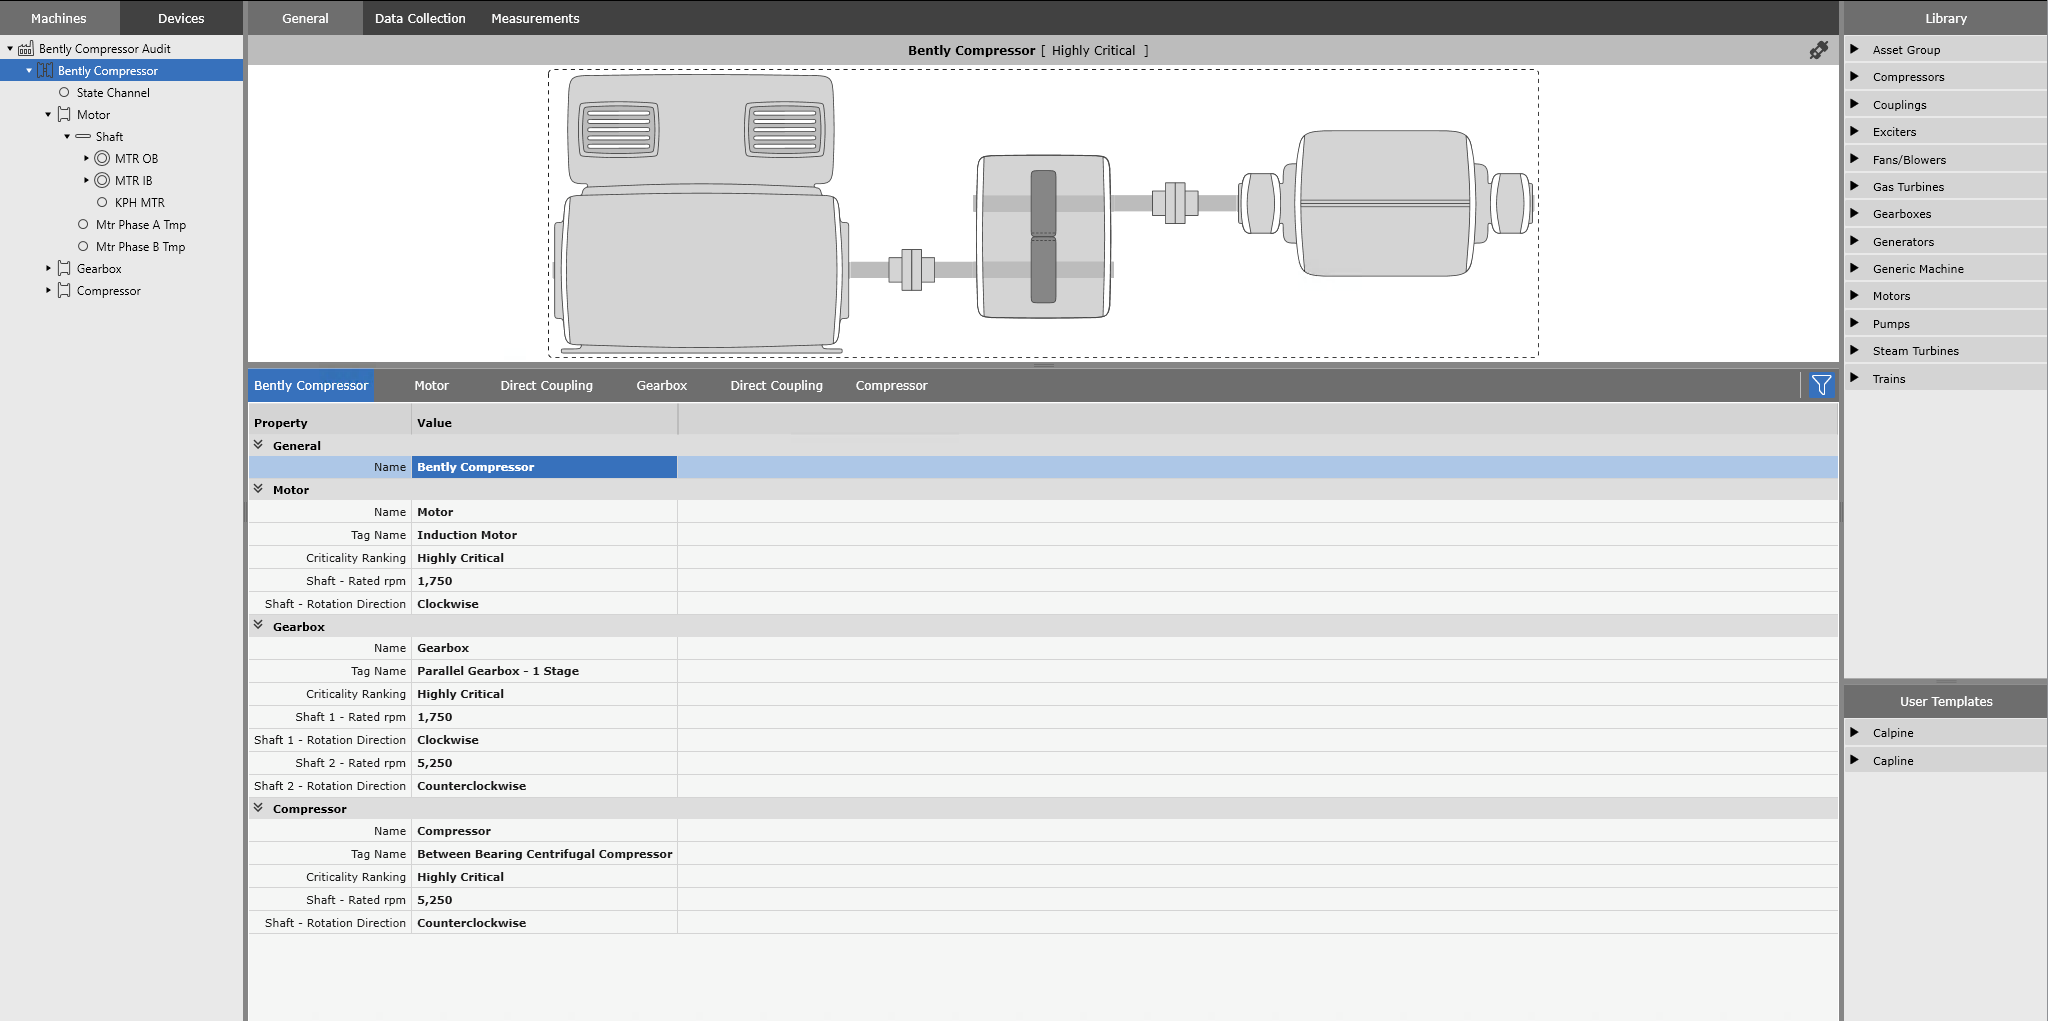
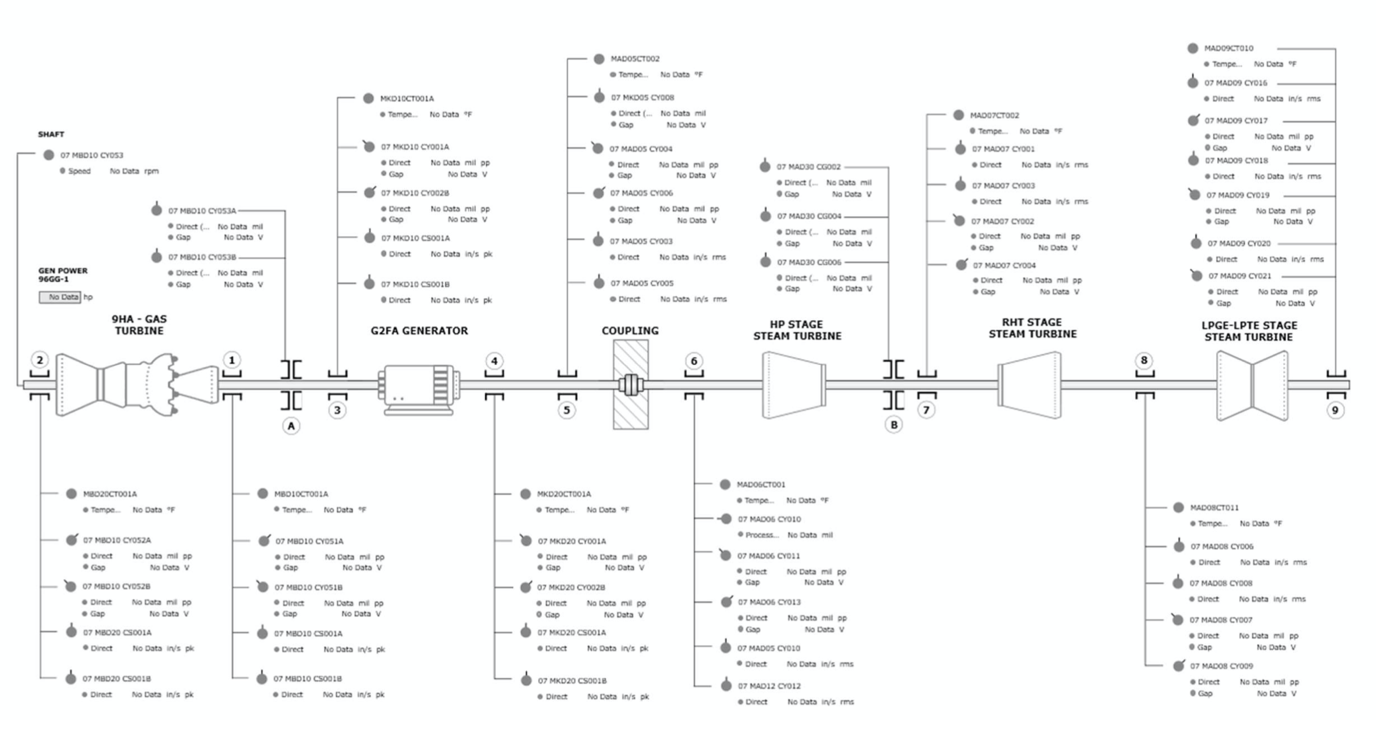
An extensive library of turbomachinery asset models are available in the System 1 Configuration Library, including Centrifugal Compressors, Gas Turbines, and Steam Turbines. These models are outfitted with standard sub-components (e.g., Shaft, Section, Bearing) and machine properties, allowing users to quickly drag, drop, and build their highly critical rotating machines.
Machine properties, such as speed, rotation direction, and bearing clearance, are leveraged within the Plots workspace to aid in diagnostic analysis
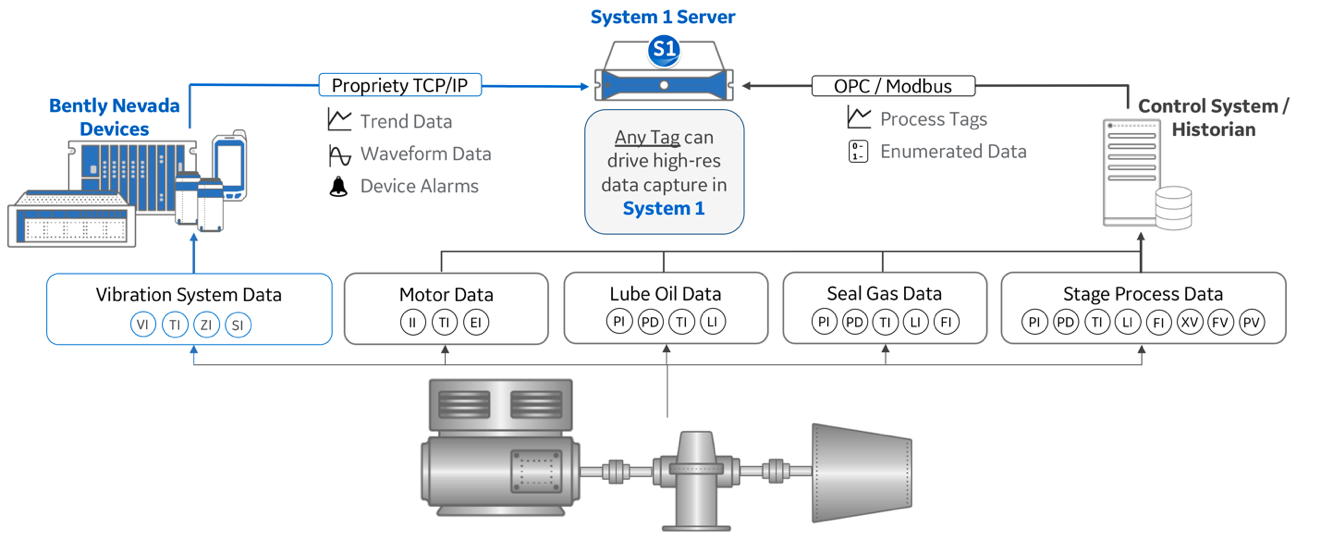
Vibration + Process Data + Control System Data
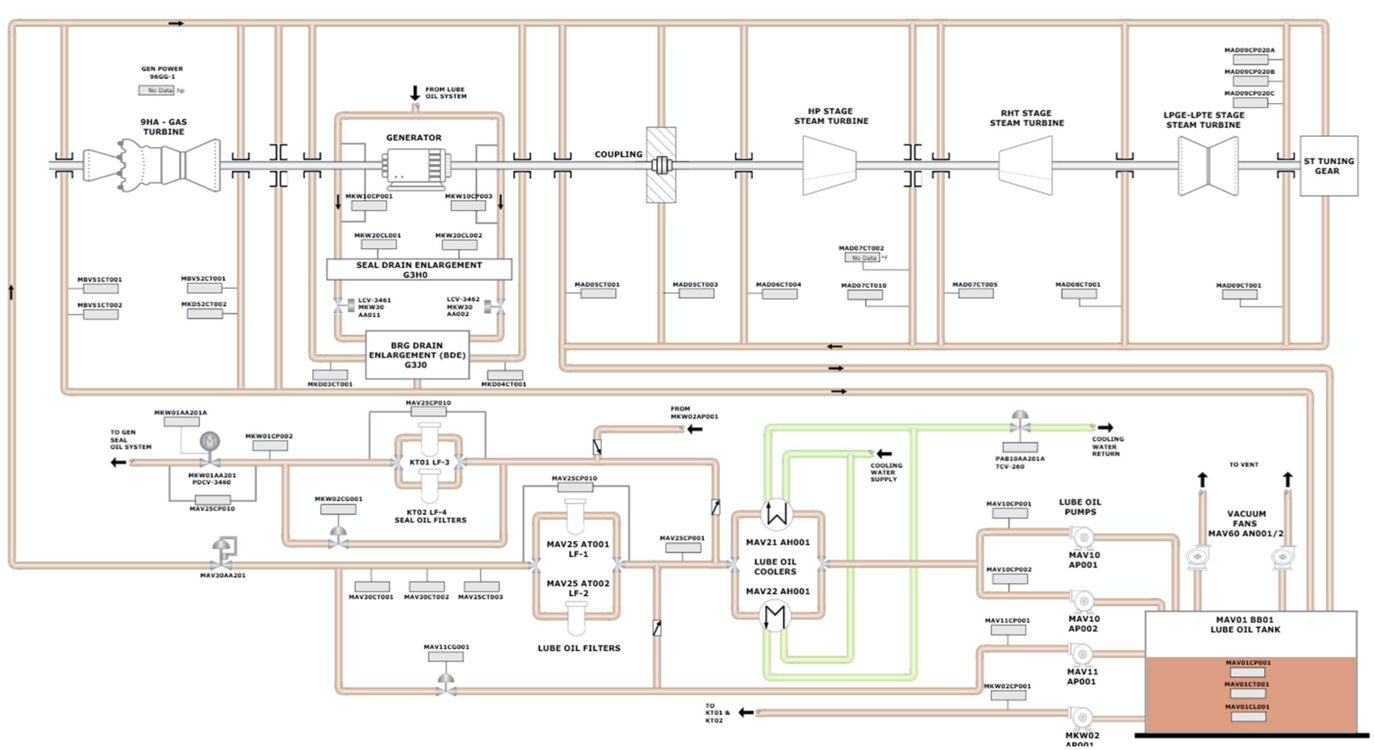
System 1 provides comprehensive connectivity to all machine data sources on the edge and collects high resolution vibration, process, and control system data. This data can be collected from one or many Bently Nevada devices, such as 3500, Orbit 60, Ranger Pro, and/or Scout with Trend, Waveform, and Device-generated alarms all imported. In turn, process tags can be collected from a Programmable Logic Controller (PLC) or another historian. Up to 15,000 OPC or Modbus tags are supported per server, allowing customers to add all process, first-out, and permissive data to enhance the asset health data available to monitor, diagnose, and manage their critical turbomachines.
Once connected into System 1, these data points can be mapped to the associated location on the turbomachinery asset, establishing asset-context for the measurement value.
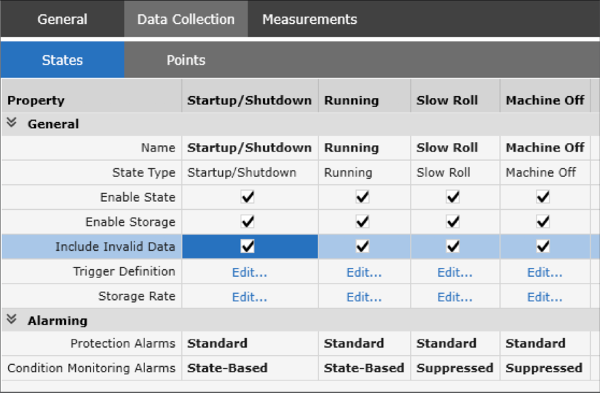
Operating State Definition
Machine states enable users to define distinct operating conditions where asset behavior is unique. For turbomachinery, four Bently-defined states are available: Startup/Shutdown, Running, Slow Roll, and Machine Off. If a user has entered a rated RPM and mapped a speed data point to the machine, the trigger definition of each of these four states is automatically configured. In addition, 30 user-defined operating states can be configured. NOTE: Any data input can be used as part of state definition (e.g., Discharge Pressure, Bearing Temperature, Suction Flow, etc.).
Operating states enable more fine control over two aspects of Condition Monitoring programs:
- Data Storage Rate: When machines are in critical operating states, higher density data can be collected and stored, enabling deep diagnostics into machine faults when required.
- State-Based Alarming: Unique alarm thresholds can be configured for different operating states. In addition, alarming can be completely suppressed in certain states, like when the machine is off.
Data Storage
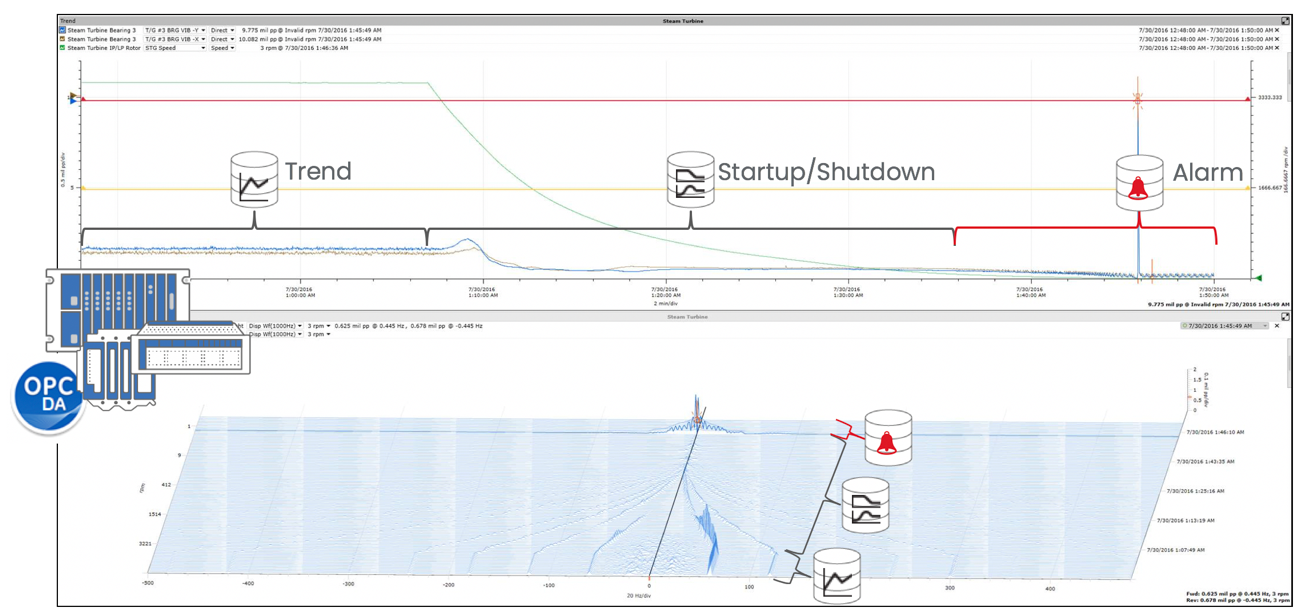
Industrial Historians and System 1 Classic utilize change filtering for data summarization. This method requires expertise to set the storage rate thresholds for each measurement, periodic database storage optimization, and may lead to sparse data that is not time correlated.
With System 1 Evo, incoming trend data can be stored at up to once-per-second, with this data retained in the Short-Term Trend Store (NOTE: Modbus data can be stored at rates of up to 200ms). This guarantees that high density, time-correlated data will be available when a turbomachinery issue requires deep investigation. In addition to Trend Data, even higher resolution data is captured in the case of Alarm or Startup/Shutdown Events. When these events occur, high-resolution data is collected from any tag mapped to the machine train, with some Bently Devices supporting up to 100ms static data collection.
All stored data (e.g., Trend, Alarm, Startup/Shutdown) can be replicated from the Process Network to the Business Network, enabling users to conveniently perform proactive and real-time management of their turbomachinery from many locations: alongside the Operations team, from their office, or from centralized monitoring centers.
Pillar 2: Analytics
Condition Monitoring Alarms
The analytic foundation of any condition monitoring system is threshold-based alarms. Within System 1, threshold alarms can be configured per machine operating state, with adjustable settings for time delay, latching, and suppression. Four levels of alarm setpoints can be configured per measurement, regardless of the source of the data (e.g., Bently Device, OPC).
In addition, users can also configure OPC or Modbus import tags representing external system setpoints, with a maximum of 60,000 tags supported per System 1 server. These tags automatically update with the source system (e.g., PLC, DCS), ensuring that users leveraging System 1 for holistic machinery monitoring are always seeing the same setpoints as Operations.
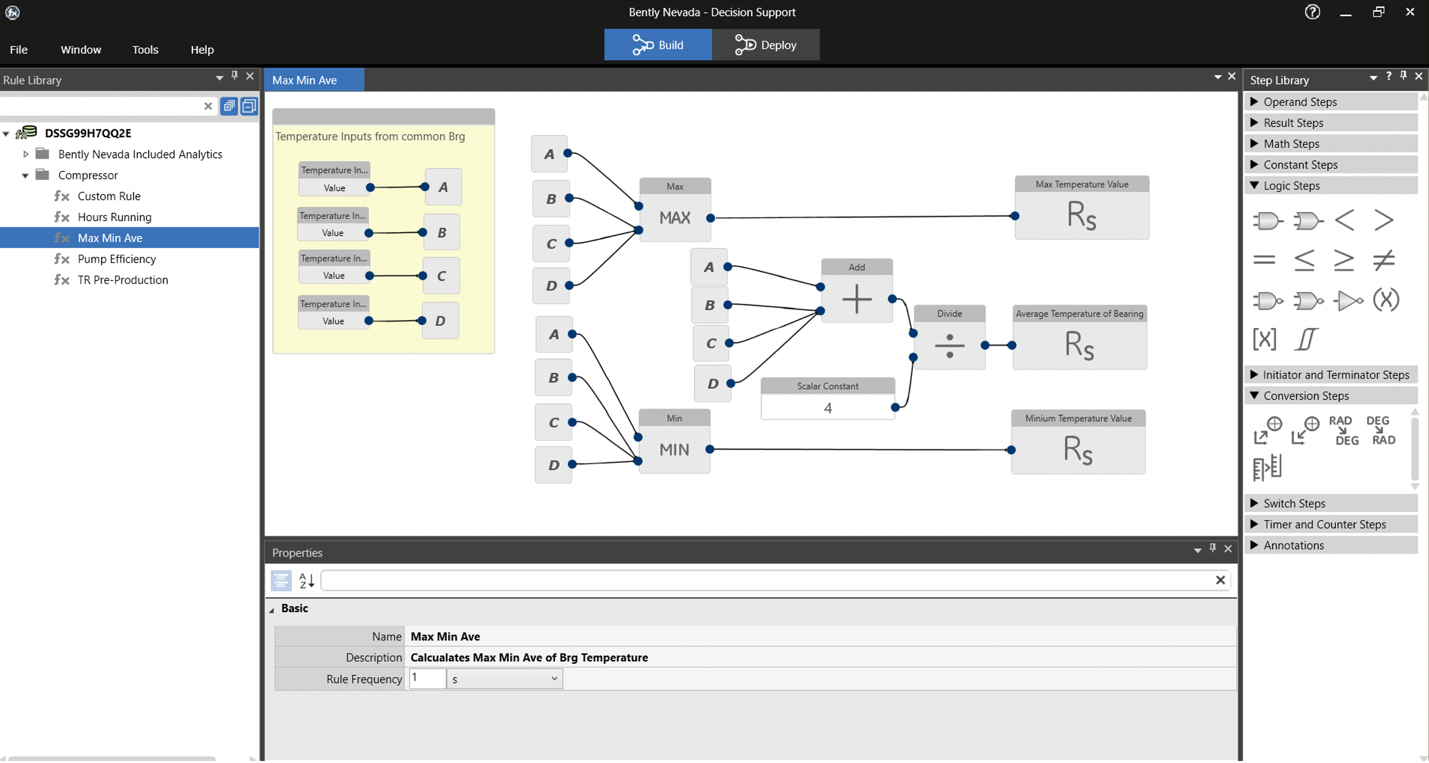
Decision Support Developer
Turbomachinery management can be enhanced through the utilization of Decision Support Developer. This analytic application natively integrates with System 1, enabling turbomachinery engineers to tap into the rich dataset of System 1 and write custom rules that codify their machinery expertise. The results of these rules are populated within System 1, where they can trigger alarm notifications and events, be visualized alongside supporting data within the Plots workspace, and verified by utilizing the rich diagnostic toolset.
This codification of machinery knowledge captures the expertise of engineers that have been monitoring turbomachinery for decades, ensuring that this knowledge does not retire alongside the personnel. In addition, created rules can be shared between sites, allowing operators to take advantage of these insights across their asset fleet.
Bently Nevada’s Decision Support includes an extensive library of extraction rules allowing engineers to gain new insights related to the health of auxiliary systems and process systems associated to turbomachinery.
Decision Support Analytics
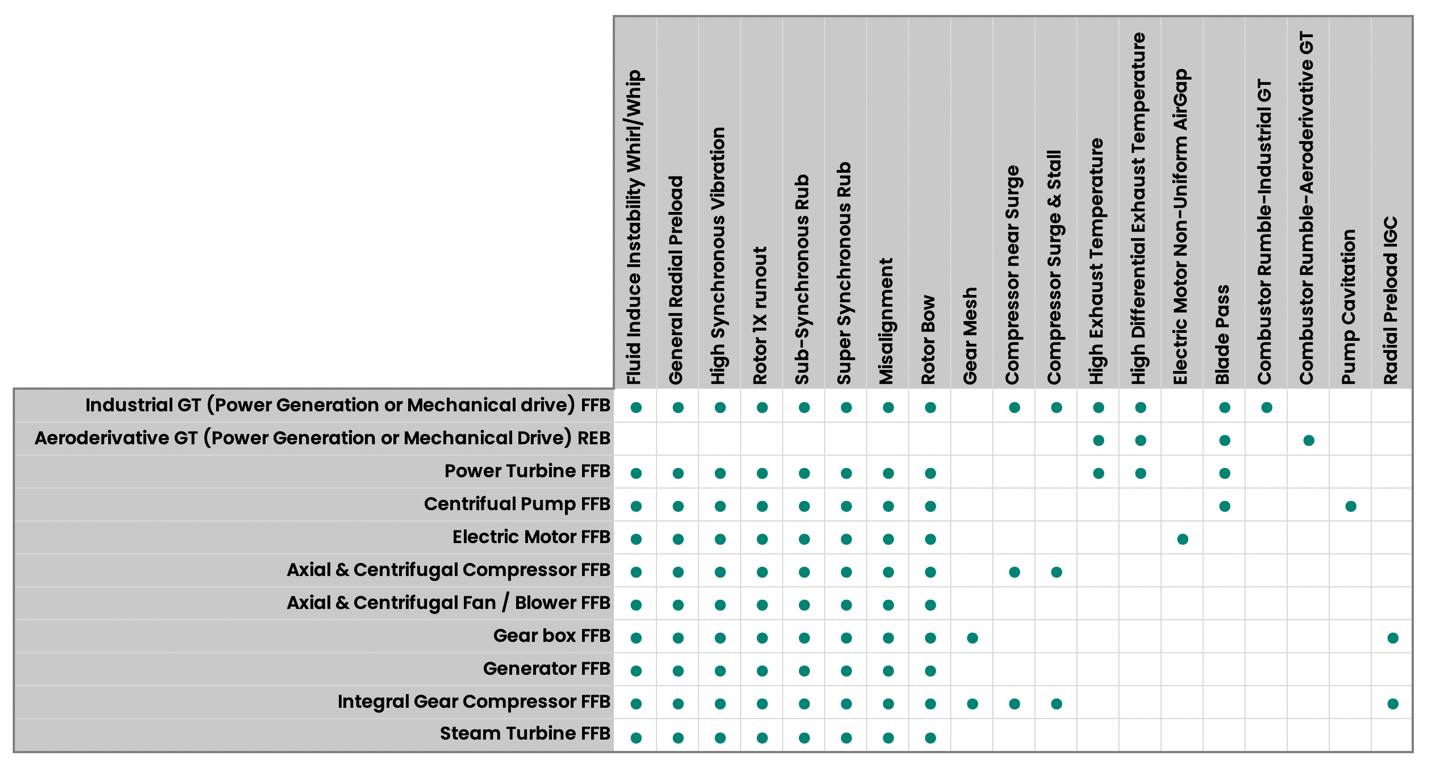
Decision Support Analytics can be applied to specific machines within System 1 to perform continuous real-time data analysis to detect early changes in machine behavior and identify targeted failure modes. While Decision Support Developer equips end users to create their own rules, Decision Support Analytics are Bently-defined rules that diagnose malfunctions by using machine configuration information, real-time data, and asset operating states. Decision Support Analytics are based on Bently Nevada’s decades of experience monitoring turbomachinery.
A list of detectable turbomachinery faults are included below, with new Decision Support Analytics continuously being developed and released.
Pillar 3: Visualization
HMI Mechanical and Process Views
The HMI workspace enables customers to visually represent turbomachine health by graphically depicting machine layout, current measurement values, and alarm status for both the machine, its sister assets, and supporting sub-systems. Navigational links can be added to any HMI view within the database; advanced users may elect to jump from HMI-based screens right into diagnostic plots, while higher-level users may elect to jump to sub HMI views or trends.
Alarm Events with Supporting Data
The System 1 Events workspace logs all device-generated events, along with any alarm triggered from a configured setpoint in System 1 or an integrated rule from Decision Support. These setpoints can be configured on any measurement within the application, including vibration, process, and control data. Setpoints can be synchronized with external systems to ensure a harmonized view for Operations and the Machinery Team.
When alarms trigger, Email or Mobile notifications can be sent to one or more stakeholders, containing supporting information, such as Tag Name, Configured Setpoint, and Measurement Trigger Value. Within System 1, the workspace visualization updates to reflect the presence of the alarm event, with color propagating within the hierarchy and status views.
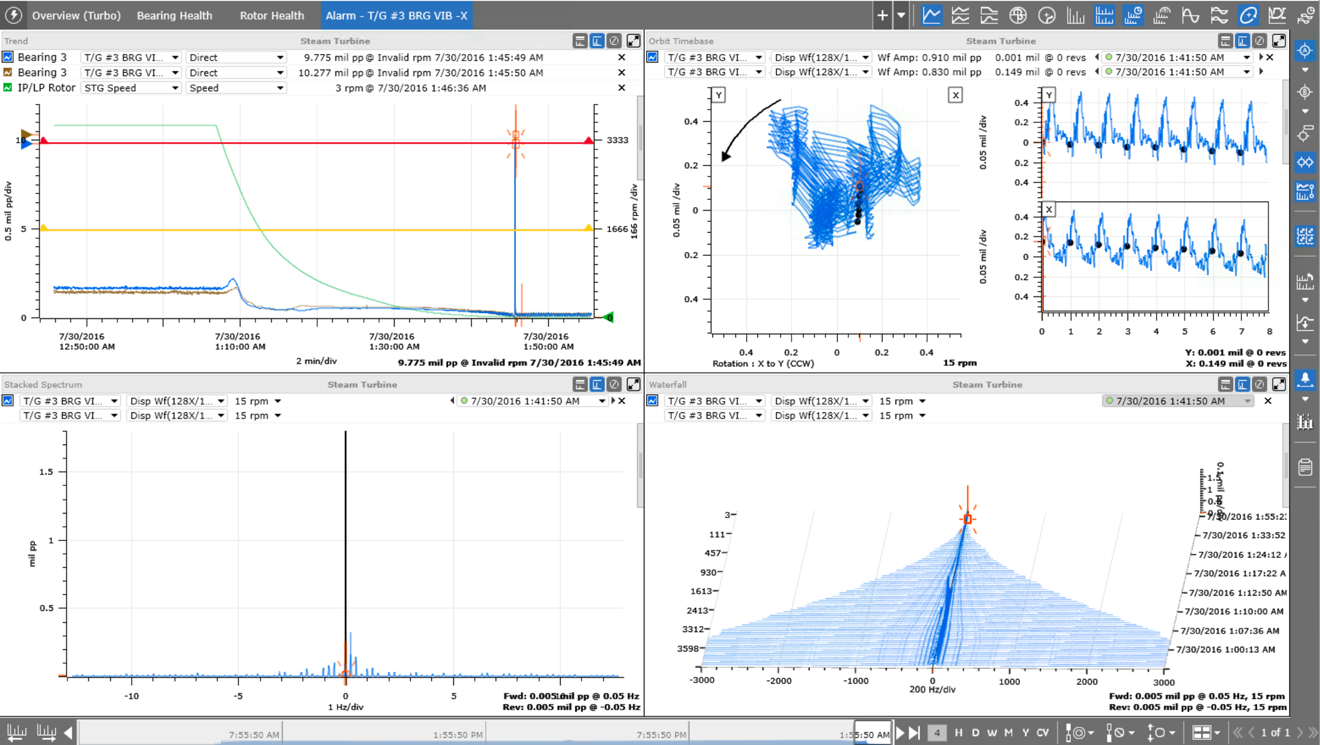
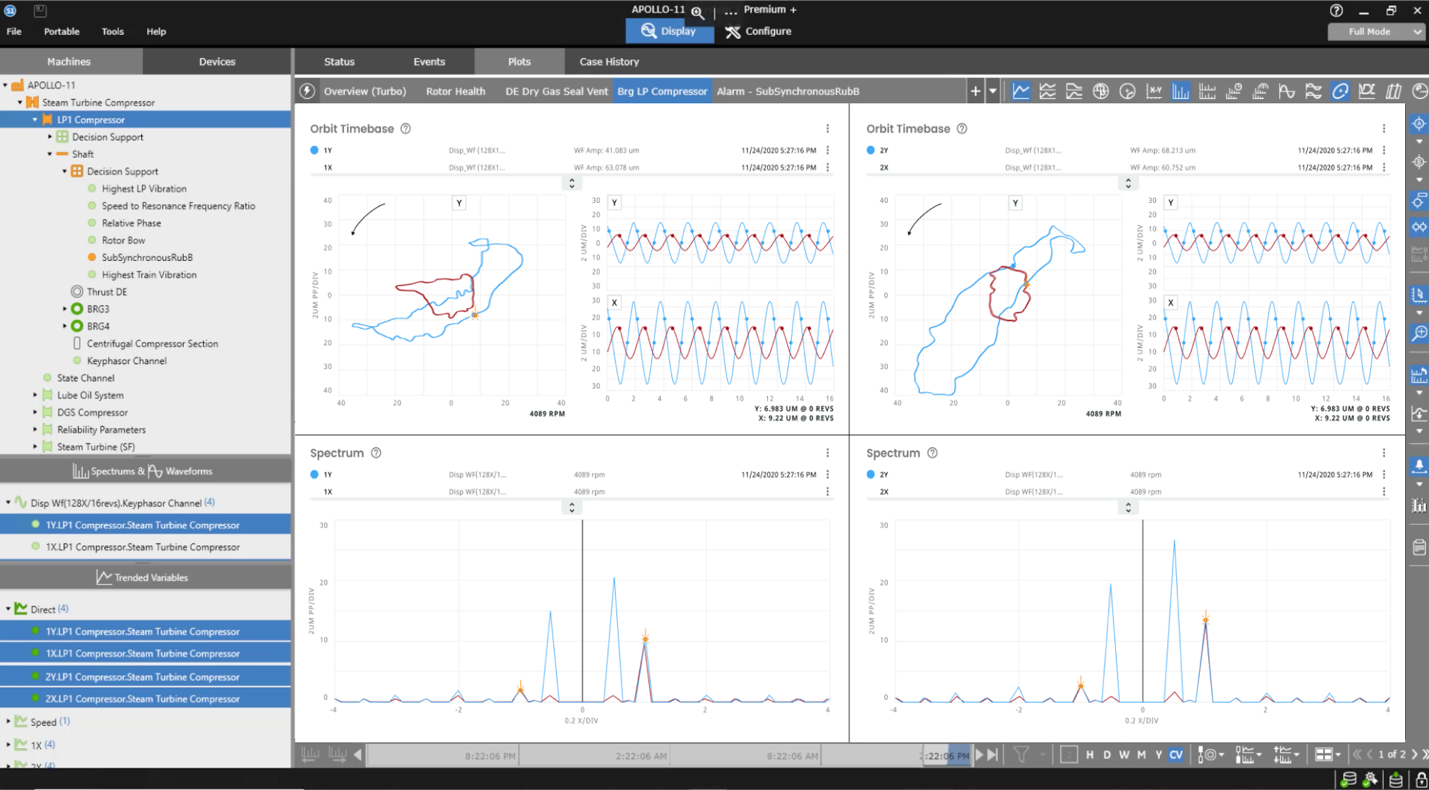
The Events List displays the logged alarm event. Upon double-click of this alarm, a supporting Alarm Plot Set allows Machinery Engineers to view supporting data around the time that the event fired. For turbomachinery vibration alarms, the alarm plot set includes:
- Trend plot with Bearing X/Y Direct Measurements + Speed, with the cursor defaulted to the entered timestamp of the alarm event
- Orbit Timebase plot of Bearing X/Y Synchronous Waveforms, with the sample defaulted to that closest to the timestamp of the alarm event
- Full Spectrum plot of Bearing X/Y Asynchronous Waveforms, with the sample defaulted to that closest to the timestamp of the alarm event
- Full Waterfall plot of Bearing X/Y Asynchronous Waveforms
Correlated Data Analysis
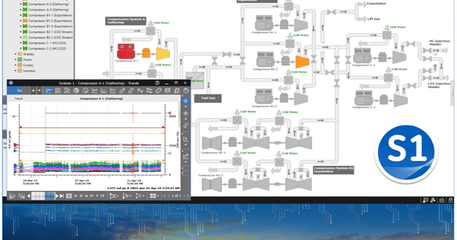
System 1 allows users to view all vibration, process, and control data within a single plotting workspace, with a multitude of plotting formats available. As all data is stored at up to 1-second rates, measurement values can be easily correlated. This enables users to mix and match data presentations to get a complete picture of machine behavior.
All of the rich plot types and tools required for turbomachinery diagnostics are available. Machinery Engineers can combine plot types within a single view to compare machine behavior across different plotting formats, apply compensation to eliminate run-out, and overlay reference baselines to compare current machine condition to a past time when it was operating normally.
Case Management
As part of their digital transformation journey, Industrial Operators are striving to aggregate all data into a single and connected ecosystem. While this includes the sensor data that is measuring real-time vibration and process values, it also includes the fault analyses, notes, and other case artifacts that document asset health over time.
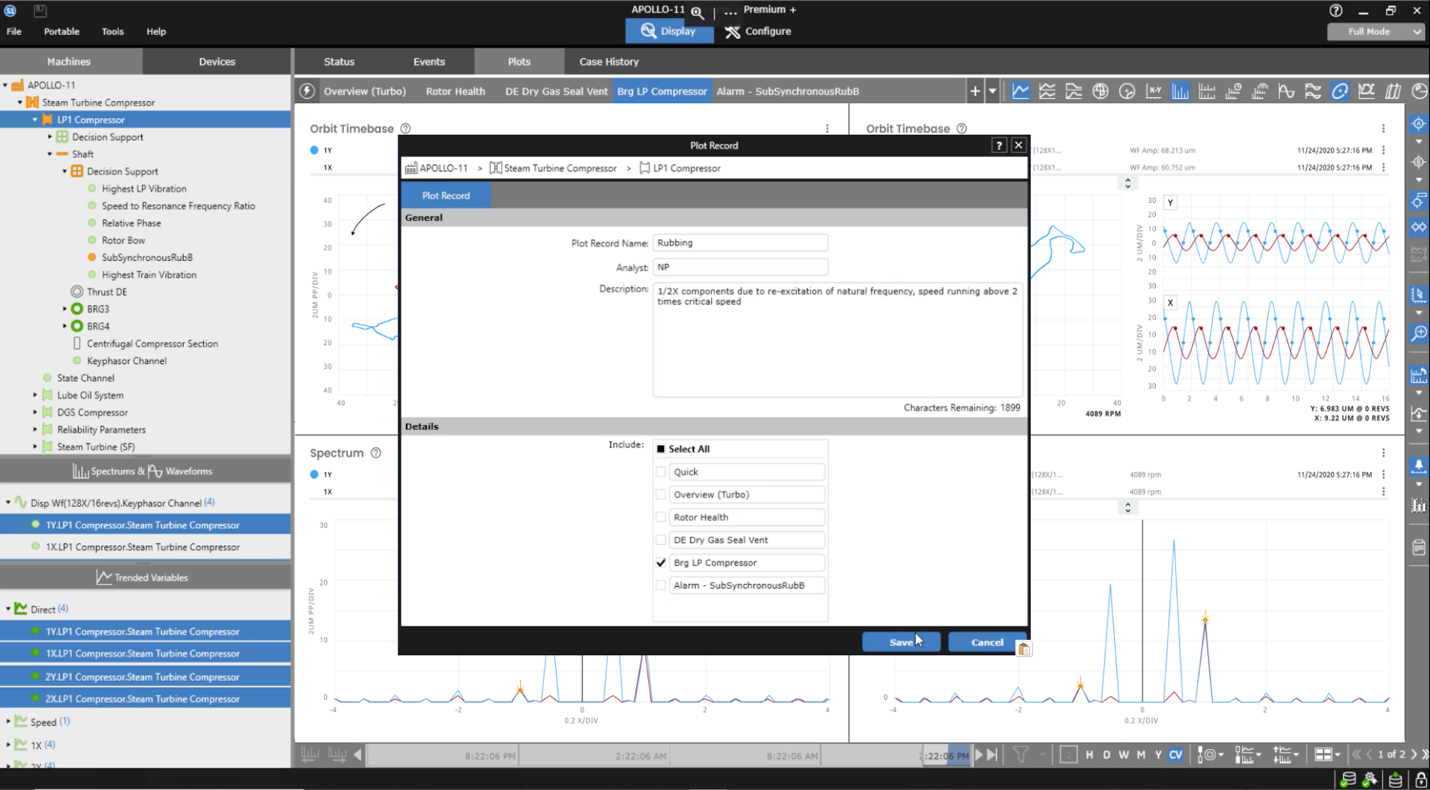
Within System 1, Machinery Engineers can capture these case details and store them as part of the central database. Machine Fault Reviews, Plot Records (which visually capture asset condition), and observation notes can be tagged to turbomachines or any other assets within the System 1 Database and are available for review by all users, enabling more effective collaboration.
Connectivity + Analytics + Visualization = The Solution in Action!
The following scenario presents a real-world turbomachine fault condition. It demonstrates how the System 1 Capabilities of Connectivity, Analytics, and Visualization combine to support early fault detection, fault confirmation, and corrective action.
At an LNG production site, refrigeration compressors and their drivers are some of the most critical equipment within the facility. Compressorr asset health data is connected to System 1, with high-resolution vibration and process data stored in a central historian, alongside the asset health data of auxiliary equipment. In addition, System 1’s Decision Support engine is constantly processing data from the System 1 historian, performing real time calculations, analytics, and diagnostics.
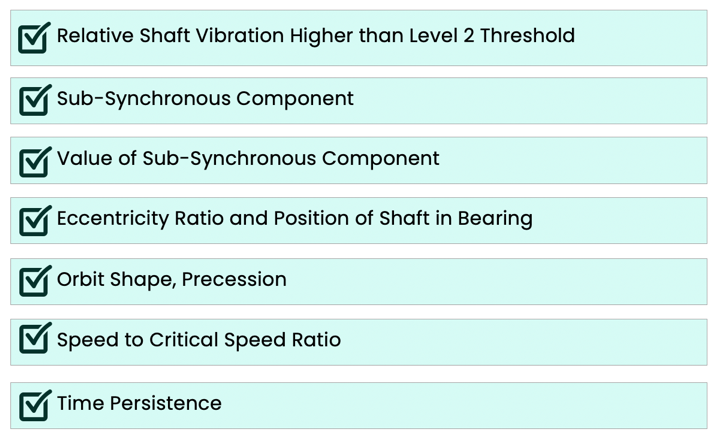
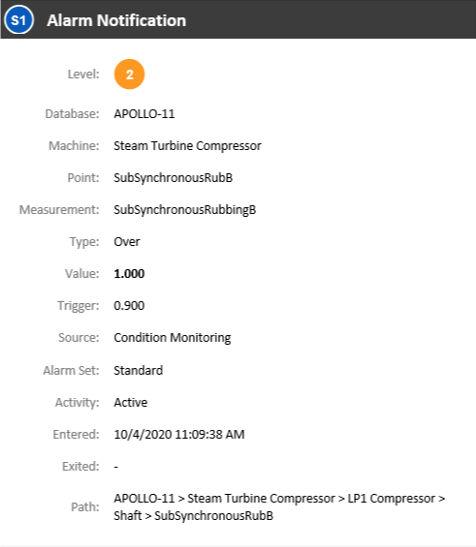
Late in the morning, an Decision Support Analytic alarm is fired, indicating that there is a rub condition on the refrigeration compressor. To generate a positive fault detection, the analytic confirmed a number of machine behaviors, including vibration amplitude, eccentricity ratio, orbit shape, and persistence.
The Machinery Engineer responsible for the asset receives an email notification, highlighting the problem asset, alarm level, failure mode, and date and time stamp of the event. Upon receipt of the message, the Machinery Engineer launches System 1 to evaluate the condition.
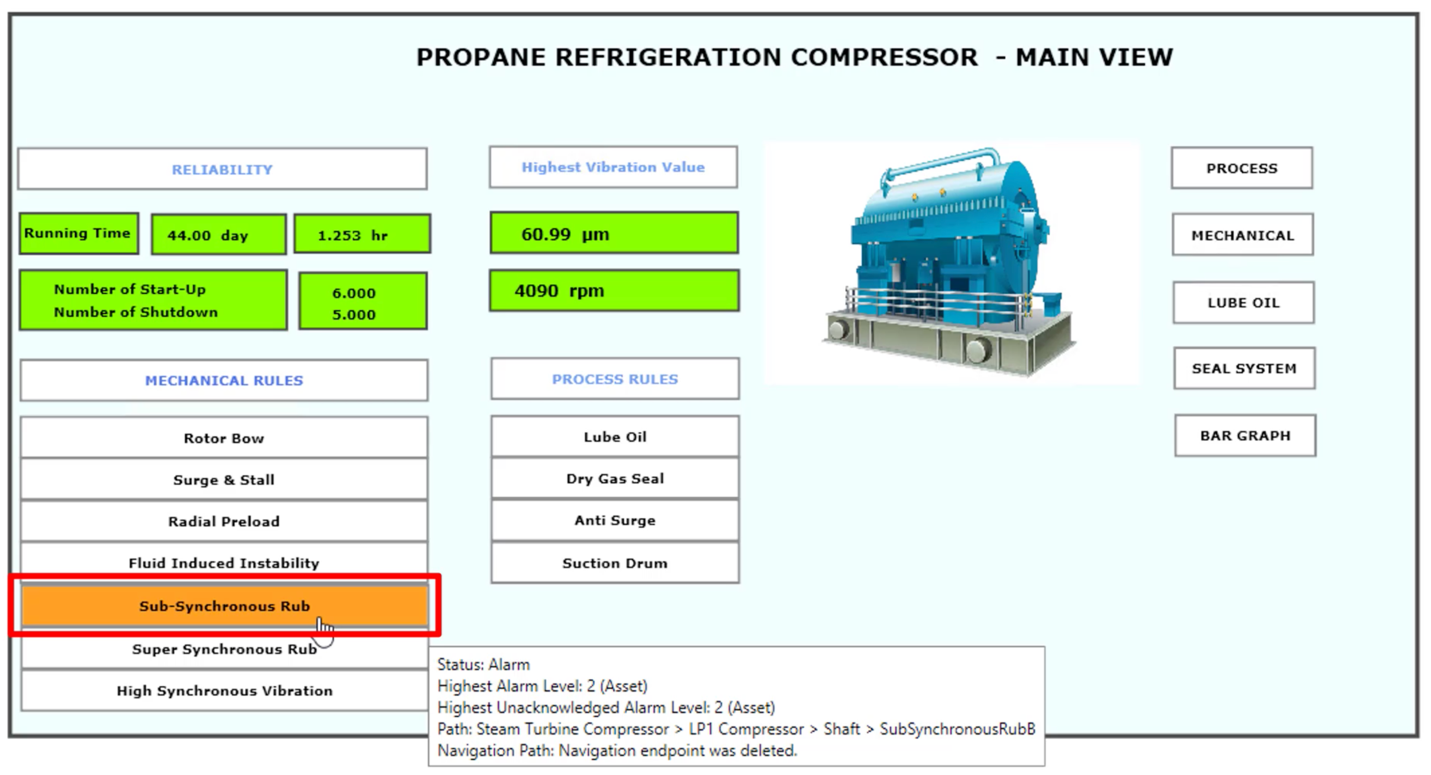
Using System 1, the Machinery Engineer confirms the identified compressor is in alarm and quickly scans the HMI screen to see if other alarms are present. While there are no other active alarms, the Engineer can see Key Performance Indicators (KPIs) that the Machinery & Reliability Team created in System 1’s Decision Support, including:
- Running time of the compressor
- Number of machine startups and trips
- Highest vibration from all vibration transducers on the Refrigeration Compressor
The Machinery Engineer navigates to the Events workspace and double-clicks on the Decision Support Analytic alarm, which launches the Alarm Plot set for the event. The Engineer notes that the operating state has not changed and the speed has remained consistent, indicating that the event was not associated with a changing machine state.
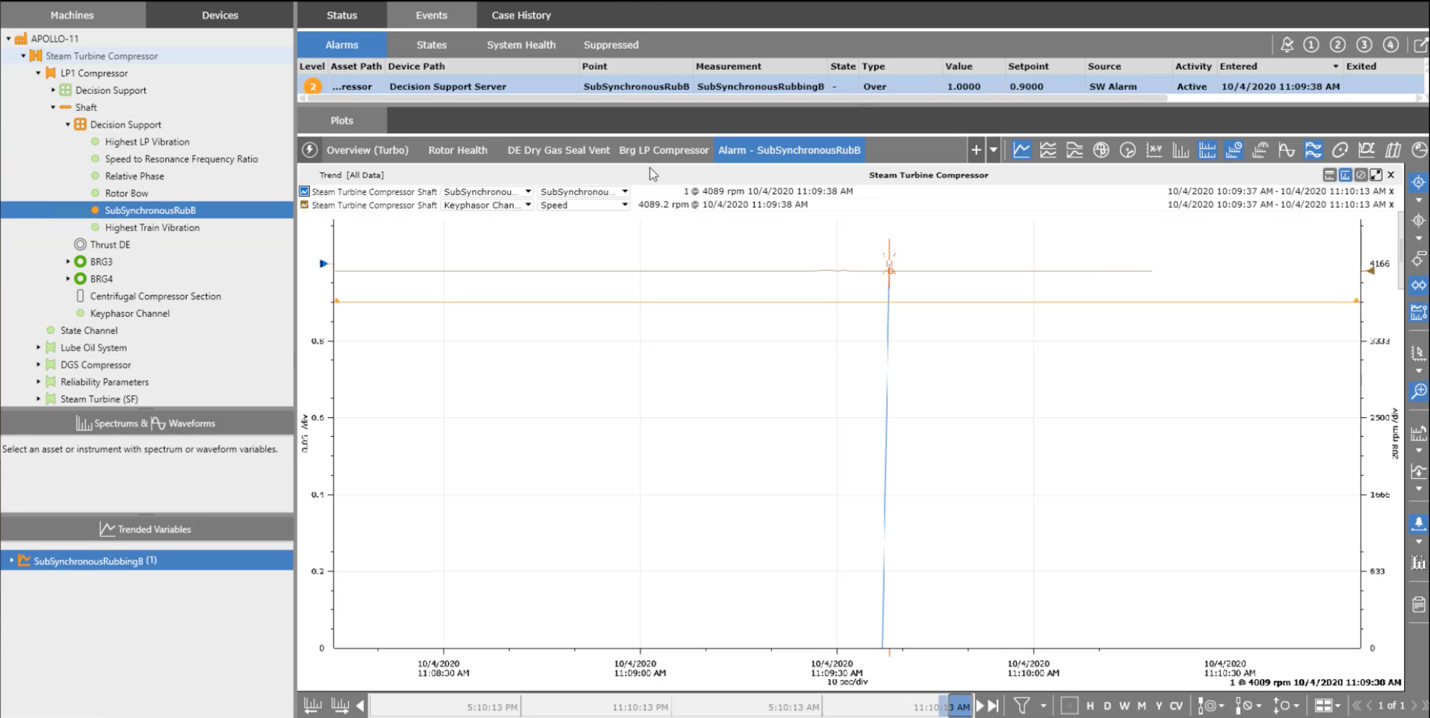
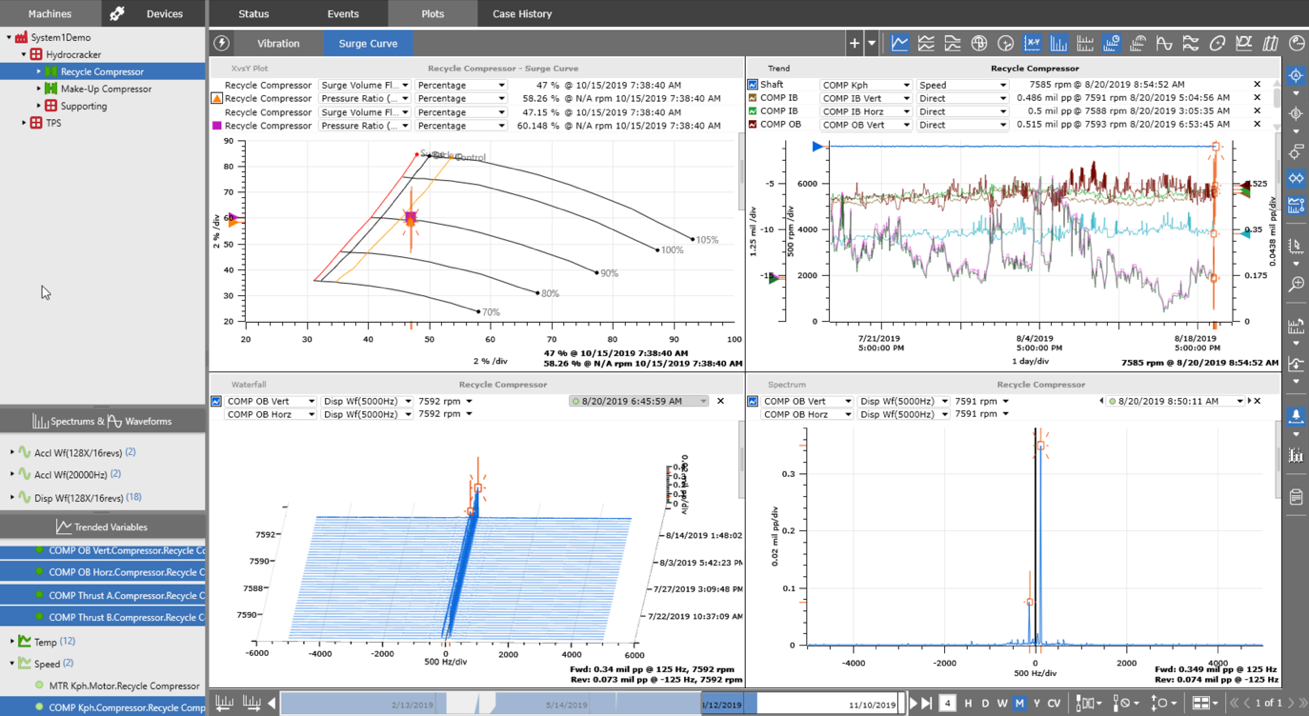
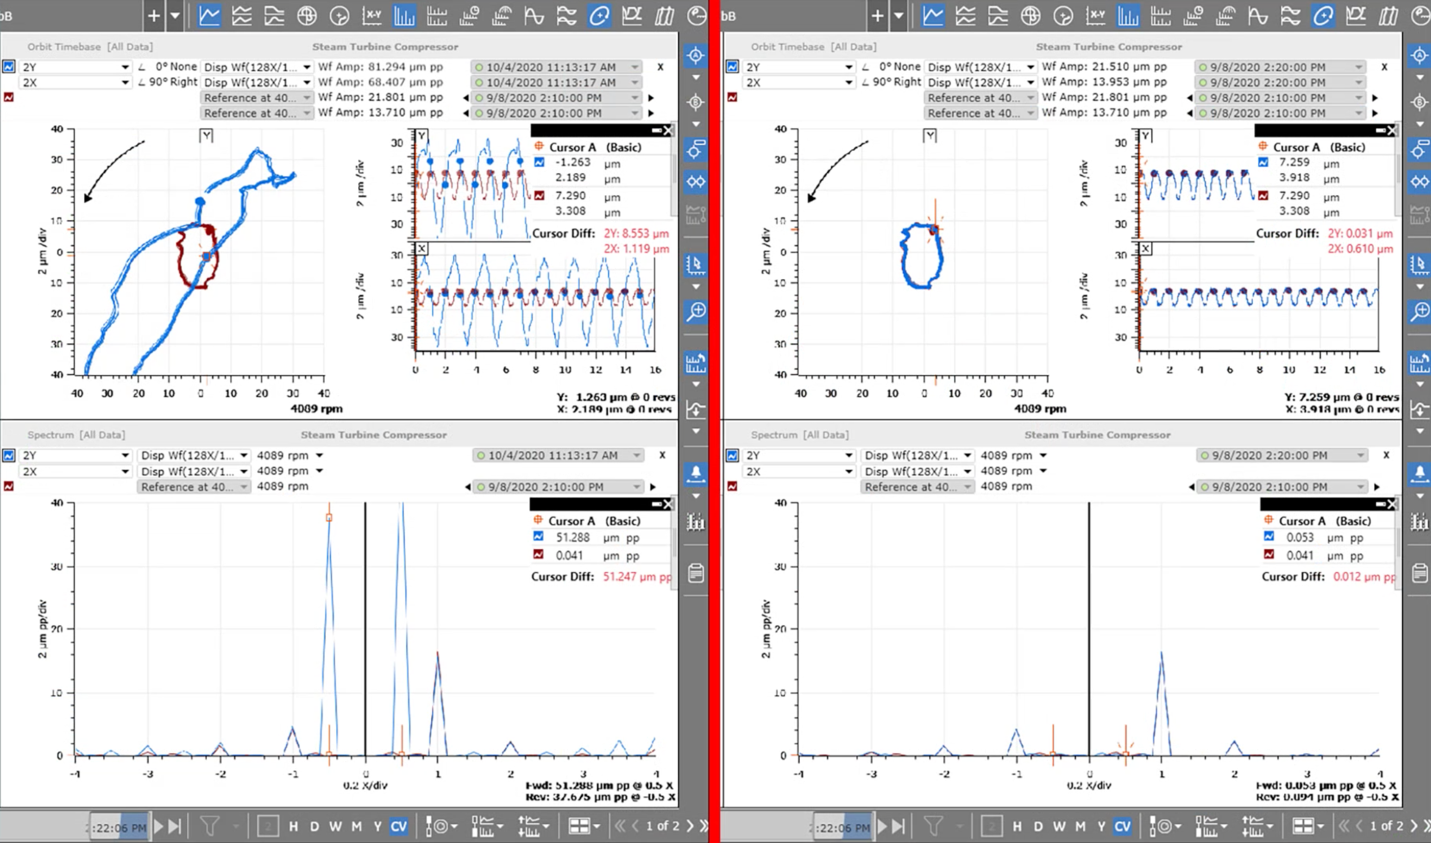
The Machinery Engineer launches the Orbit-Timebase and Full Spectrum plots to do a deeper analysis of the dataset collected during the alarm event. He overlays the reference baseline that was collected when the machine was commissioned and can clearly see a difference in behavior between current condition (blue) and baseline data (maroon).
The Machinery Engineer documents the rub condition in System 1, saving the plot view as a Plot Record that can be viewed by him and his teammates in the future. He then instructs the Operations Team to achieve a stable thermal condition to eliminate the rub condition.
Acting on the recommendation of the Engineer, Operations is able to achieve thermal stabilization of the compressor train, and the rub condition is resolved, returning the rotor response to normal.
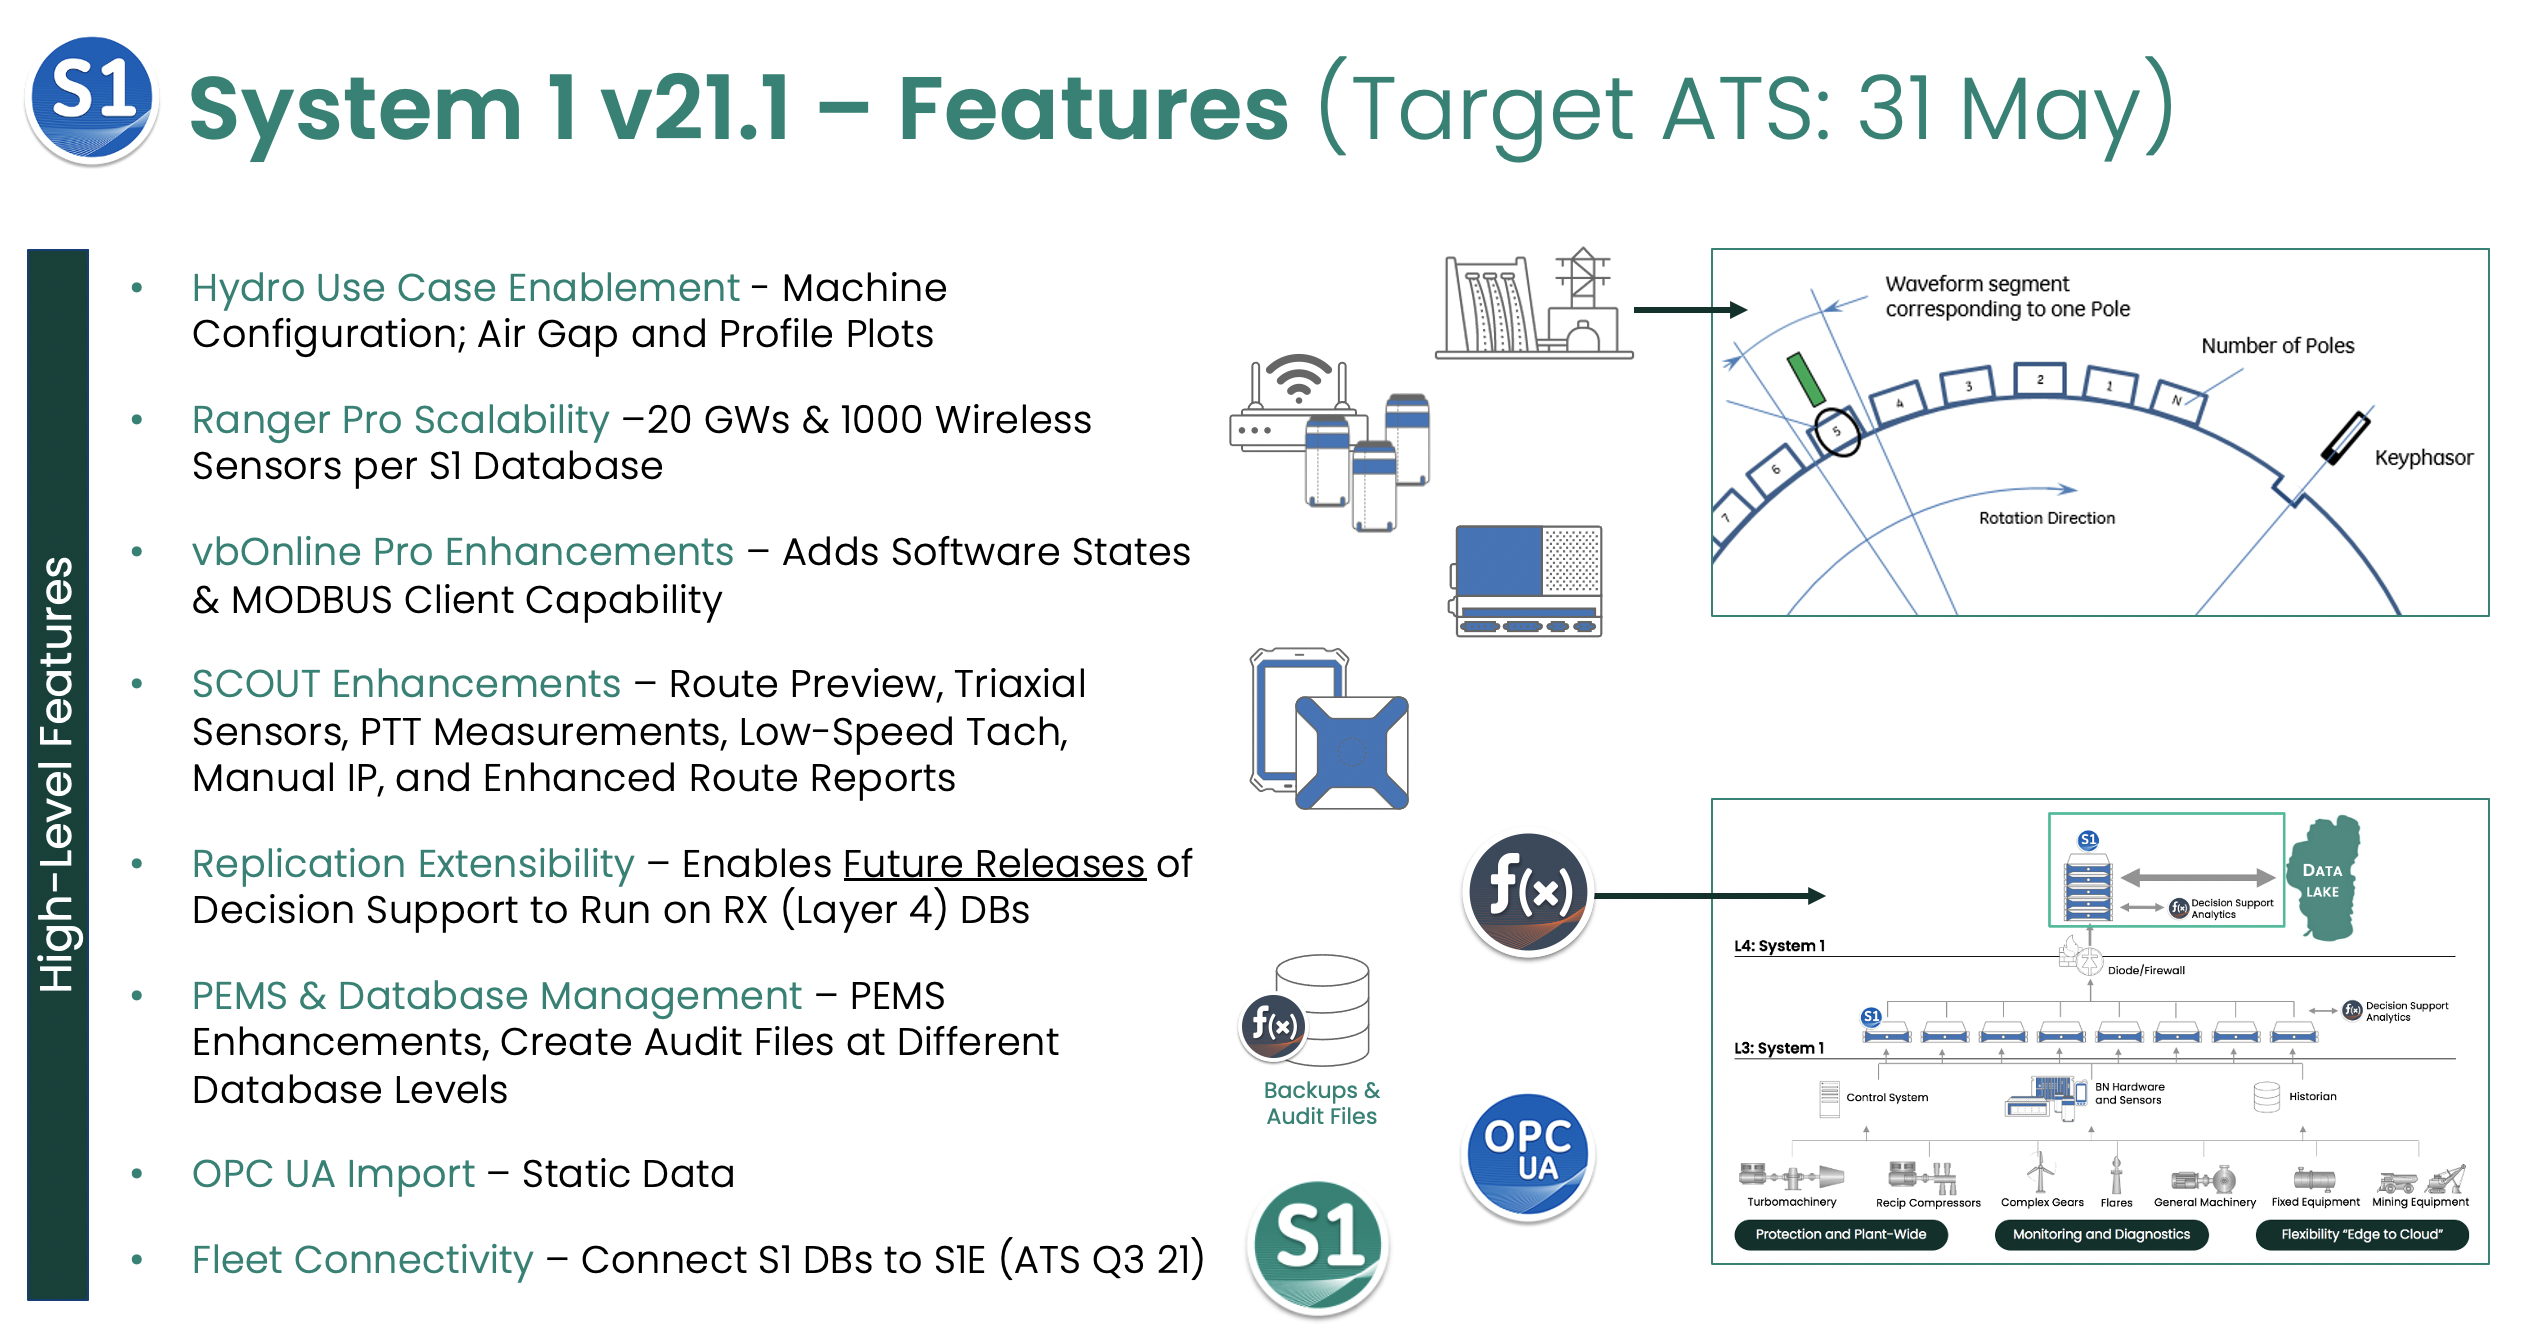
What’s Planned for v21.1
System 1 v21.1 will be released in late May 2021. This release will deliver major new capabilities to the Hydro Monitoring, OT/IT System Integration, and General Machinery Monitoring use cases provided by System 1. A list of included capabilities is captured below.
Learn More about System 1
Prior Orbit Articles
System 1: Plant-Wide Monitoring with Clarity and Context
Celebrating 20 Years of System 1
Use Case: Thermodynamic Performance Monitoring
Upcoming System 1 Orbit Articles
The deep capabilities of the System 1 Platform will be explored in upcoming releases of Orbit magazine. Planned articles include:
Q1 2021 Reciprocating Compressor Analytics
Q2 2021 Monitoring Hydro Generation Assets with System 1
Q3 2021 The System 1 Ecosystem – Connected Asset Management from Breadth to Depth
Q3 2021 Roll Monitoring in Pulp & Paper and Steel Manufacturing with System 1
Q4 2021 Introducing System 1 Enterprise
Q4 2021 System 1 Advanced Analytics
With many more to come…
Our Experts

Jackie Tappan
System 1 Technical Product Manager
BIO
As the System 1 Technical Product Manager, Jackie guides product vision and manages the ever-evolving backlog of features. She has led multi-country user research initiatives, collecting input from 300 unique end-users across 5 continents.