

Gas Piping Condition Monitoring Deployment

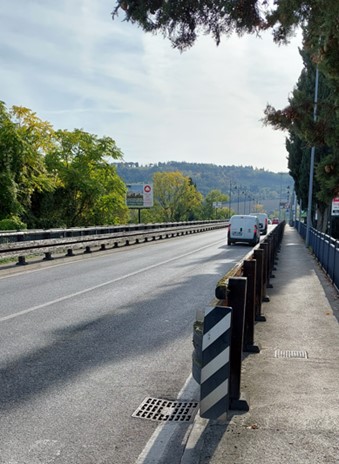
This case describes structural tests performed on the gas pipe and piping supporting system installed along a bridge. These tests were part of an investigation that was done as a preparation for the monitoring system installation. The objective was to obtain the information regarding the vibrational responses, the natural frequencies, and the related modal shapes, to optimize the distribution of permanent sensors. These sensors will form part of the condition monitoring system - to be installed in the immediate future - which will allow early detection of system degradation and overall prevent catastrophic failure.
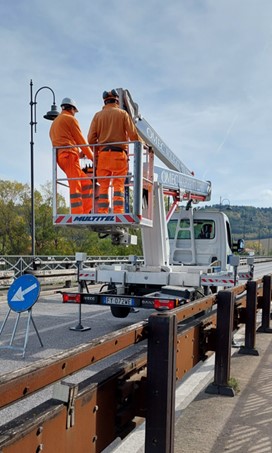
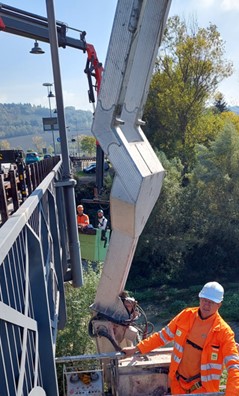
Access to the requires structural areas was challenging and required utilization of two different cranes have been used with the support of third-party manpower to be able to optimize the roving accelerometer methodology.
The experimental modal parameters (natural frequencies, modal damping, and mode shapes) of the piping have been extracted from the data measured. As preliminarily planned, the test allowed BN to understand the expected positions to be used for the permanently installed sensor which is the part of the condition monitoring system.
Bently Nevada (BN) Machinery Diagnostic Services (further referred as MDS) has been invited to evaluate the possibility of monitoring the intensity of induced vibration on the gas piping mounted under a road traffic bridge. In fact, the main scope is to evaluate, via the amplitude level, the risks connected to the structural integrity of the system, strictly connected to the possible condition degradation of the bridge (and in general of the structures where the piping is anchored) which can lead to interruption of the continuity of gas delivery. The objective is obtaining the information regarding the vibrational responses, the natural frequencies, and the related modal shapes, in order to optimize the distribution of permanent sensors which will be form the condition monitoring system to be installed in the immediate future.
It has to be noted that Italgas does not own the bridges, but their piping structures are strongly dependent from bridges stabilities.
It has also been highlighted that in 2018, during a rainstorm on 14 August, a 210-metre section of ponte Morandi viaduct collapsed and tragically 43 people died.
After extensive analysis of the structural failure were executed, the collapse raised concerns about the general condition of infrastructure in Europe, with studies in Italy, France, and Germany suggesting that a significant number of bridges are in need of renovation or replacement due to corrosion and structural deterioration.
Since no previous tests were reported on this structure and no theoretical calculation were ever executed, it was not possible to anticipate the expected piping response.
Therefore, before the test, a thorough assessment of methodology plus a site survey had to be executed, in order to prevent any possible difficulties that could have been encountered during data acquisition.
Finally, before mobilizing to site, the following possible solutions were drafted:
- Solution 1 for test: Full structural test to be executed measured eventually with and without cars (to have better understanding about excitation).
- Solution 2 for test: Motion amplification (MA) camera to do a preliminary test. Subsequently we will perform a structural test but with targeted amount of points (as suggested by motion amplification results).
Due to the non-standard request, the MDS Engineer had to think out of "his comfort zone" and the survey was scheduled with the aim of answering to the following questions:

And after a thorough survey and a detailed discussion, the final solution decided was:
- Full Modal analysis.
- 2 cranes needed with subcontractors (1 for the hammer and 1 for the triax sensor).
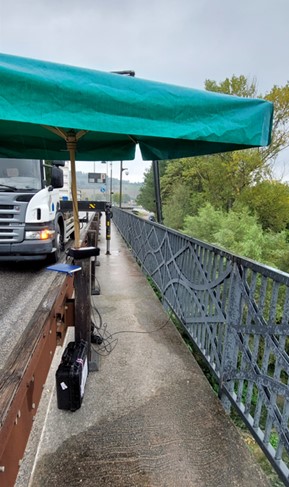
- MDS to supervise the activity from the bridge and using the BN Scout140 Portable Vibration Analyzer & Data Collector.
- Magnet base to be used for the sensor.
- 4 BNC-BNC cables 100m long needed.
- 1 week planned (considering the need of reposition the cranes, 4 averages needed for every point and eventual need of retaking few points after preliminary analysis).
Therefore, all the premises were suggesting that nothing could go wrong.
Unfortunately, the majority of us knows very well the following rule:

And, even if we know that theoretically this "law" is not always applicable, during the execution of the test there were several practical demonstration of this rule.
Murphy's law - Practical demonstration 1:
- Expectations: Meeting thoroughly planned with third party contractor at 7am on the bridge
- Reality: At 12:00 still nobody from third party contractor was there, because, due to an issue with the crane rental. They arrived with about 5 hours of delay.
Murphy's law - Practical demonstration 2:
- Expectations: BN required 2 cranes to easily access the piping under the bridge to allow efficient Modal data collection - "roving" of the sensor along the required locations, while exciting (hitting) another location on the bridge.
- Reality: Third party contractor brings1 crane.
- Ok, so maybe that's still enough....
- Not too fast: The crane wasn't tested on the bridge and it couldn't reach the piping!
Murphy's law - Practical demonstration 3:
- Expectations: Finally, during the second day, the correct crane attended site. Unfortunately only 1 crane rather than 2 but perhaps an increased speed from the MDS Engineer in the data acquisition process could have allowed to still finalize it on time!
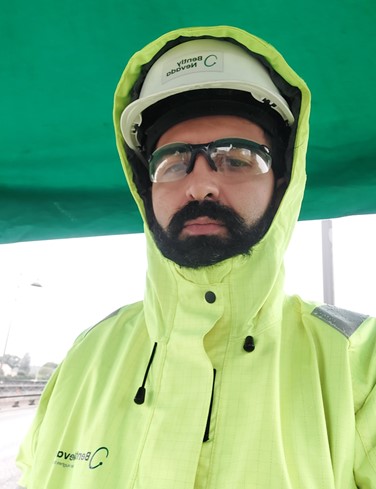
- Reality: At 10:00 of second day there was heavy rain (Fig 9) and, in accordance, this generated a "not so sunny" response from the MDS Engineer's face (Fig 10).
Murphy's law - Practical demonstration 4:
- Expectations: Data collected without any criticality till early afternoon
- Reality: At 16:00 the data began indicating some noise, and, after a loop check, there was the evidence of the triaxial cable being broken

However, it was apparent that the axial vibration was not the main contributor to vibration.
As the activities were adequately planned the MDS Engineer utilized the backup single axis sensors to continue data collection.
In addition the second crane was now present, thus the activity accelerated dramatically and the test was still finalized on time and the third day.
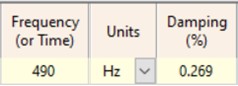
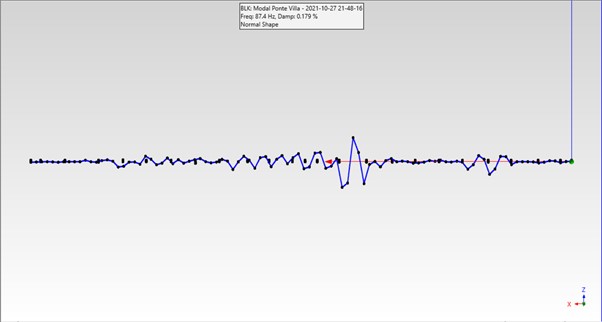
Here below are indicated the modal parameters extracted by the post-processing of the experimental modal measurements. The post processing was performed with ME'scope ( Vibrant Technology) software. The natural frequency found with automatic interpolation in the range from 0 to 500 Hz is indicated in the pictures below. For the mentioned natural frequency, it was also indicated the corresponding modal damping, in terms of percent of the critical damping:
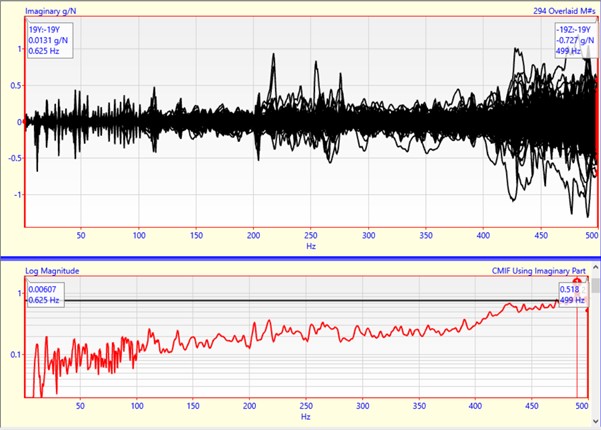
The sources of excitation on the bridge and/or directly on the piping are not fully known and repeatable, these are mainly due to car/truck passing on the bridge and other phenomenon like earthquakes. These sources were expected to typically excite the low frequency range therefore, there was no clear need to extend the frequency range over 500Hz.
Of course, with the source of excitation not being definitive, no segregation margin can be calculated between excitations and natural frequency. Other possible modes, in the lower frequency range were not apparent either due to a lack of excitation force from the impact hammer or were highly damped, so that no clear response can be seen while making an overall interpolation of the piping response. Therefore, some local interpolations were executed as shown in Fig 16 to Fig 19:
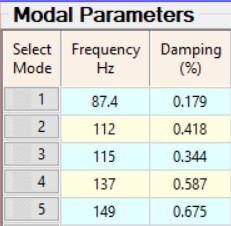
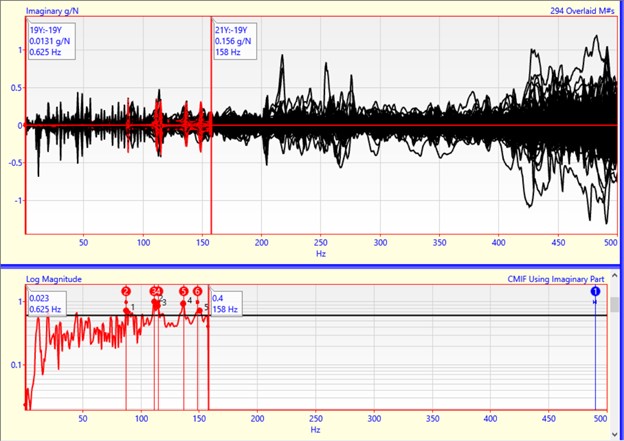
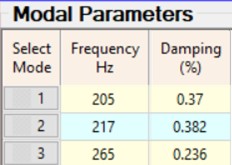
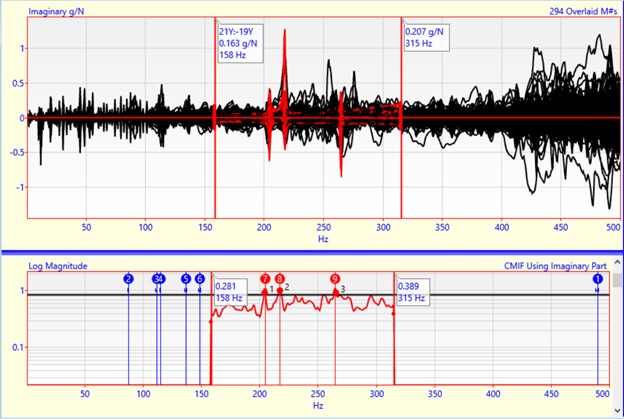
Fig 20 shows a mode shape, associated to one of the abovementioned natural frequencies, obtained by the overall interpolation.
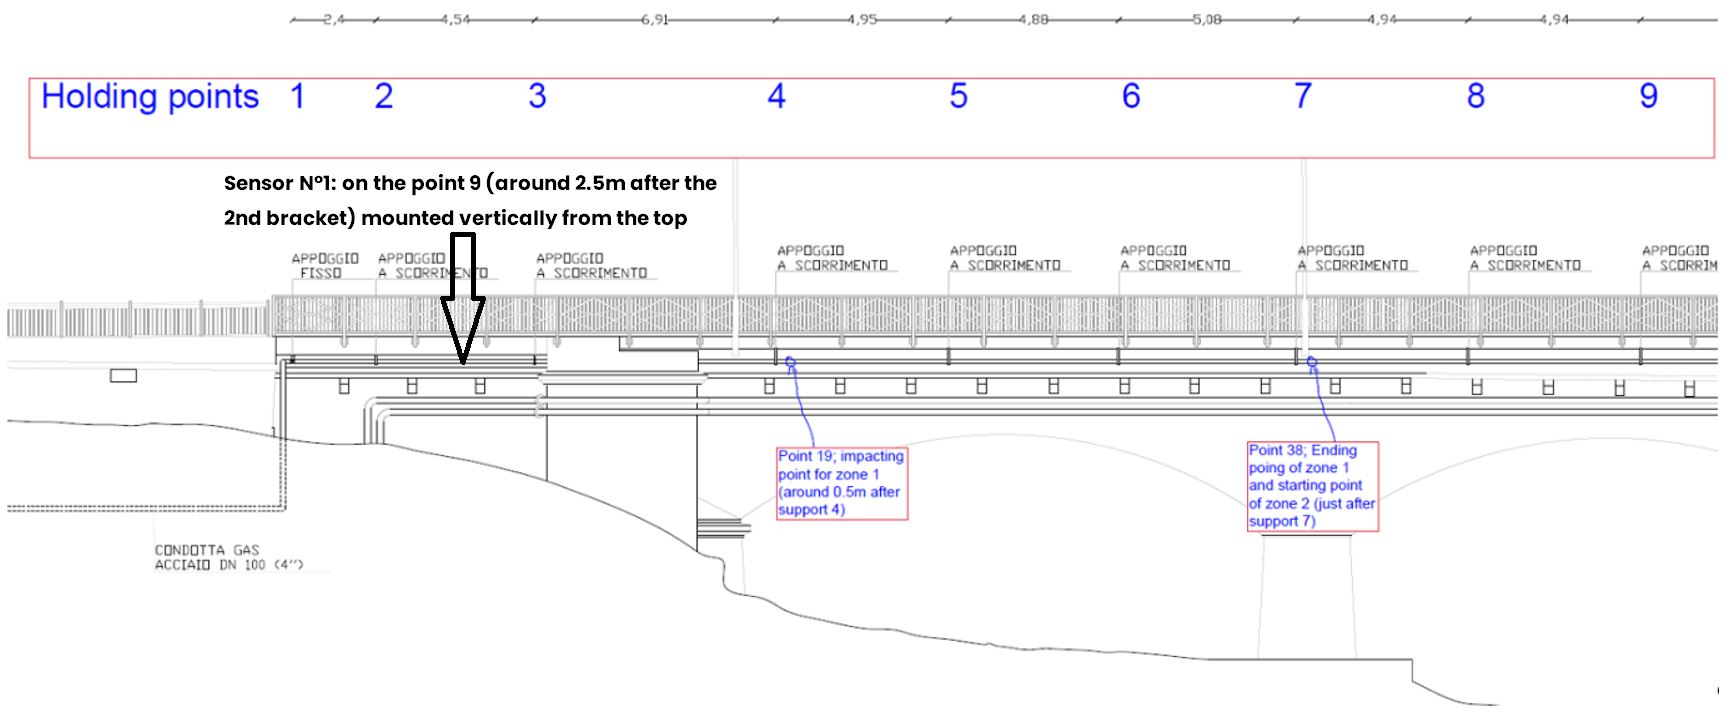
Through comparison of all the mode shapes obtained from each natural frequency, a clear distribution of permanent probes installation was defined. Utilizing this approach would avoid sensors being positioned on nodal points which, from their definition, do not have a response for the related mode - thus no valid information would be retrieved with sensors positioned in those locations.
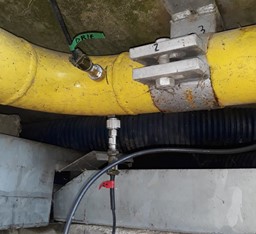
An example of detailed instruction for the sensor installation is outlined in Fig 21 and a total of 12 sensors were planned to be installed on the piping:
- Sensor N°1: on the point 9 (around 2.5m after the 2nd bracket) mounted vertically from the top.
- The direction has been chosen also taking into account the ease and the integrity of installation considering the sensors too much exposed to atmospheric environment if oriented in horizontal direction.
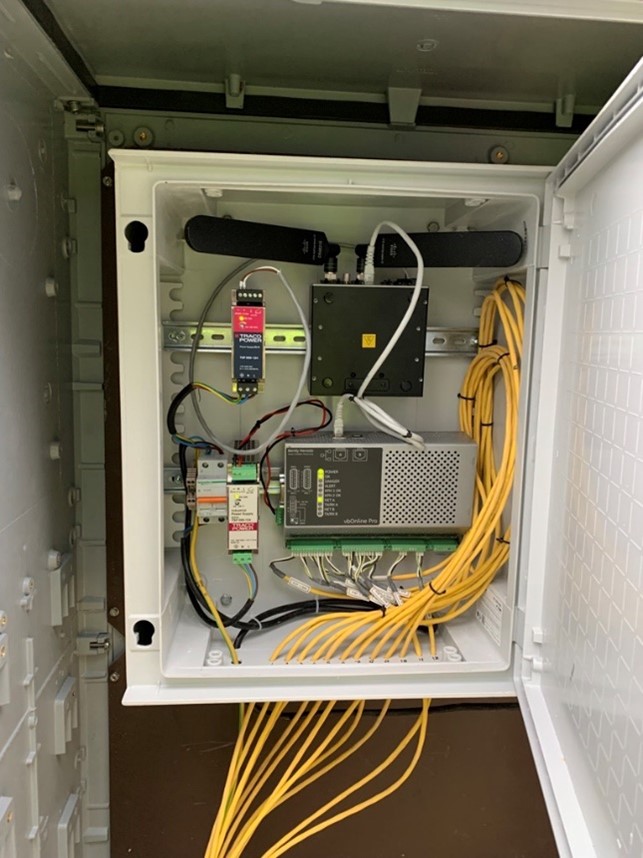
To provide effective condition monitoring and overall minimize capital expenditure, the BN System1 Evo monitoring and diagnostic platform was deployed through the "Bently Connect" hosted solution (Fig 24). On site probes were wired to VB Online Pro, which is providing vibration data via secured Internet connection to the BN Remote Monitoring Center (RMC). All data is stored in the hosted environment and access for analysis remotely.

Subsequent to the system setup and to the data collection initiation, the first month of data has been acquired.
Based on the data collected, some spectral bands have been configured, in order optimize the monitoring and develop further understanding of the variation in the normal condition of the piping.
From first principles the natural frequency is given by: KM, where K is the system stiffness and M its mass. A change in the stiffness - due to the loosening of a structure or to fatigue being weakening the material and possibly damaging the system) - would change its natural frequency. A change in the excitation - which at the moment, as already stated, is unknown - could increase or decrease the response of the system, exciting with different amplitude its natural frequencies.
Following an example taken directly from System 1 configuration:
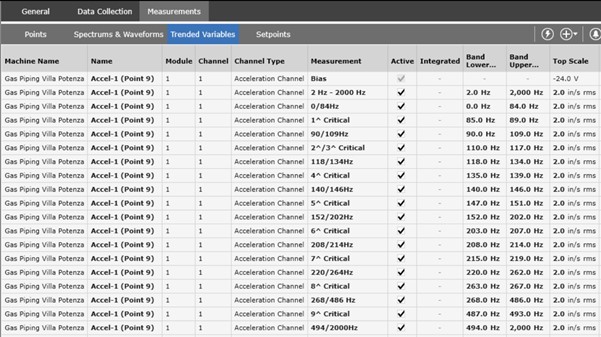
After having created the frequency bands, some Statistical Alarms (for each spectral band) have been calculated using the average and the standard deviation for the following parameters:
- Overall vibration level (global vibration amplitude measured by each sensor) to capture the overall health level of the system.
- Natural frequencies spectral band vibration level, in order to capture the increase of system response (increase of excitation or decrease of damping).
- "Out of band" vibration level, in order to capture the possible shift of natural frequencies (because of change in stiffness conditions).
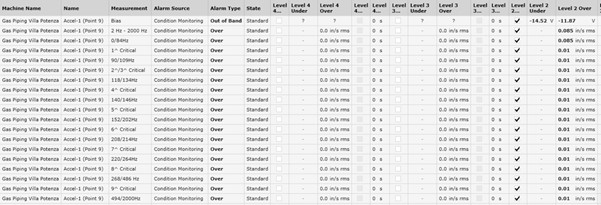
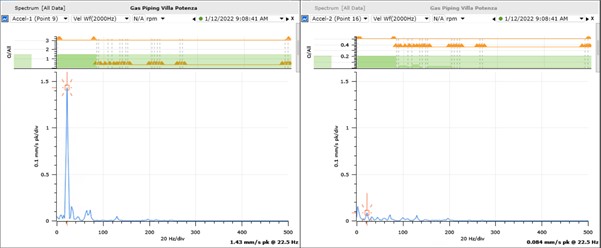
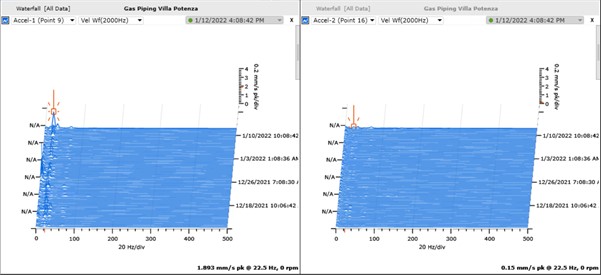
After the implementation phase, the vibration data from the first month of activity was analyzed in System1 (few examples in Fig 27 and 28) and the following consideration can be drawn:
- No critical frequency seems to be excited at the moment, neither in normal condition nor in exceptional vibration events.
- The behavior of the probes is repeatable (under the aspect of frequency components) and also as daily evolution of overall amplitude, verifying the health of the monitoring system.
- As expected, the sensors installed closer to the brackets are showing a lower overall amplitude.
- The excitation frequencies seem to be mainly 2.5Hz, between 12.5 and 15Hz, between 22.5 and 25Hz and finally between 45 and 50Hz.
- During vibrational events, the amplitude seems to be increasing in correspondence to these known frequencies and no different spectral pattern could be seen.
- There is currently undergoing a study aimed to correlate vibration content with the excitation sources. Those, in particular, are expected to be mainly related to the bridge characteristics and/or also due to car/truck passages on the bridge, but also other random excitation sources like weather and animals
- This is the first application of this type in Italy.
- if, at the end of the testing phase, the application demonstrates value, the customer is considering extending the application to other bridges supporting gas pipes within its distribution grid (for a significant achievement and future scope for BN).
- BN MDS demonstrated their advanced vibration and condition monitoring capabilities outside of their "traditional" field of turbomachinery rotor dynamic analysis, , delivering as always a best in class solution for the customer.
- A good planning and a flexible mindset can allow us to overcome any unforeseen challenges during the execution of our work.
Our Experts

Nicolas Péton, PhD
MDS Director
BIO
He is currently MDS Global Director for the Machinery Diagnostic Services.He joined Bently Nevada in 2006 and has always worked within the MDS team. He has more than 25 years of experience.

Sergey Drygin, Ph.D.
BIO
Sergey Drygin joined Bently Nevada in 2006 as an MDS Engineer and is now the MDS Technical Leader for RCIS and Turkey region. He has 25+ years of experience in machinery diagnostics on various types of industrial machinery. Sergey has a Ph.D. in Machinery and Technology.

Pierfrancesco Guagnano
Global Program Manager
BIO
Pierfrancesco, currently Global Program Manager inside Bently Nevada organization comes from a background as a SSA Site Lead for South Europe where he led the execution and growth of our service agreements. He joined originally Bently Nevada in 2016 as a Machinery Diagnostic Engineer, gaining significant experience in the condition monitoring and machinery diagnostics on various types of industrial machinery.