

Your Digital Journey to Plantwide Condition Monitoring

Foundational Support from the Very Top
Digital Transformation is such a pervasive topic that there is a tendency for our eyes to glaze over as yet another company issues a statement about its essential role in the digital journey of its customers. For some, the words are merely platitudes. For others, the words are backed up with actions, but largely aspirational actions. For still others, those actions are delivering tangible benefits, backed up by customer testimonials and case histories.
It might come as a surprise that a company like Baker Hughes with such a storied legacy in oilfield services is not just talking about Digital Transformation, but actively delivering and investing in it with a collection of businesses specifically devoted to digital solutions. And at the heart of the Baker Hughes Digital Solutions portfolio is Bently Nevada, delivering tangible benefits with its plantwide condition monitoring solutions.

When asked recently which of his offerings he was most excited about, Baker Hughes CEO Lorenzo Simonelli didn’t hesitate: “Digital Transformation!” He then explained what Baker Hughes is delivering with that statement. “The ability to really take the data that is out there, make the algorithmic sense (of it), and predict and anticipate results. Outcomes are what matter.” When asked what makes Baker Hughes Digital Solutions different from its peers, he had another succinct answer: “Software – not just hardware.” Lastly, when asked how it delivers outcomes, he was also characteristically succinct: “Downtime is your worst enemy. We’ve got an opportunity now – by taking a digital view – to actually bring down that non-productive time, and that’s going to enable higher production.” You can listen to the full 5-minute interview with Bloomberg’s Alix Steel here where he specifically mentions the role of System 1† in delivering those outcomes.
Plantwide “Islands” versus a Plantwide Continent
Even a plantwide condition monitoring solution can result in islands of data and siloed systems. Islands are the frequent result of multi-vendor solutions, but sometimes they occur even when the same vendor is used because an integrated condition monitoring ecosystem is still absent. Multiple software packages are required – each with its own operating systems, licensing agreements, interfaces, and administrative burdens. That’s why the very first step in your digital condition monitoring journey is to pick the right platform – one that is not just unified, but that delivers all of the connectivity, analytics (particularly predictive analytics), and visualization capabilities you need. There is a reason why System 1 is the world’s number one choice for this platform. It delivers all three of these essential elements and it continues to expand with two major software releases each year. We’ve been investing in this platform for more than 20 years now (it was launched in 2000), and when a platform has more than 10,000 users and represents more than 5 million cumulative developer-hours, you can be assured that it is best-in-class.
When a platform has more than 10,000 users and represents more than 5 million cumulative developer-hours, you can be assured that it is best in-class.
Digital Advantages
Let’s look at the ways a genuine plantwide condition monitoring ecosystem is part of Digital Transformation and the advantages it delivers. At the highest level, it is summarized by our CEO’s statement above: bringing down non-productive time. But let’s make that more granular with twelve tangible ways that it digitally transforms your practices and thereby delivers value.

Using wireless to eliminate safety issues and obtain previously “unobtainable” data
There are certain locations that simply can’t be addressed comfortably with a manual data collection regime. Ask anyone that has ever tried to collect data at the hot end of a paper machine. But it often moves beyond just discomfort and into the realm of safety. Maybe the machine is in a hazardous environment with hydrocarbons and other toxic chemicals present. Maybe access to the machine’s ideal measurement locations represent safety risks of falls, burns, or other hazards. Some customers will install transducers permanently and then wire them to local patch panels, but that can be expensive. Wireless vibration sensing is an ideal solution. It delivers value by eliminating wires and their associated installation costs, and it delivers value because personnel no longer have to engage in manual, walk-around data collection. As one customer quipped, “it eliminates shoe leather data”. You may still wear out your shoes – but at least it won’t be the result of collecting data from such points. It also delivers value by obtaining data from assets that may not have been practical to monitor at all in the past, allowing them to finally benefit from a condition-based approach to maintenance rather than run-to-failure or inspection-based approaches tied to running hours.
It is important to note that wireless technology is not limited to just wireless sensors. Many so-called “wired” systems can be implemented in a hybrid topology where the sensors are wired to a monitoring device, but wireless Ethernet or other wireless technologies are used to get data from the monitoring device to the condition monitoring server. Indeed, the cable itself and the labor to pull it dozens, hundreds, or even thousands of meters can be one of the most substantial costs in a project. One customer of note managed to budget for the hardware, but completely forgot about the field wiring necessary to get signals back to the control room so operators knew the status of the assets. Wireless can often “save the day” by dramatically reducing such costs.

Using online systems to eliminate “shoe leather” data and redeploy personnel more productively
Wireless systems are not the only way to eliminate manual data collection. Wired systems can also accomplish this objective and are appropriate when the data collection intervals of wireless sensing solutions are inadequate. In fully or partially wireless systems, part of the savings are reduction of non-recurring costs by elimination of wiring and associated labor. But one recurring aspect of savings that spans both wired and wireless systems is the elimination of manual data collection. As one large US refinery put it, they were so busy collecting data that they had extraordinarily little time to analyze data and act on that data. As they introduced online systems, they did not reduce the number of personnel in their reliability team – they simply put them to more productive use by being able to focus on identified problems and address root cause so the failures did not reoccur.

Catching failures before they progress
When you don’t have the data, you cannot make informed decisions. Clearly, a plantwide condition monitoring ecosystem that is collecting data from every asset represents a better situation than when “flying blind.” The key, though, is to manage assets by exception. Nobody has time to review the data from each and every asset by tedious examination of plots. One of the big advantages of modern software is the ability to establish alarm limits that may be below those of the machinery protection systems, allowing alerts well before the mechanical issues that warrant shutting the machine down have become apparent. System 1 provides statistical analysis capabilities that can recommend “condition monitoring alarm thresholds” that are well below typical protective thresholds. Users can spend their time responding to points that are legitimately in alarm, based on legitimate alarm levels, without the effort that would normally go into establishing and maintaining alarms for hundreds or thousands of assets.

Using artificial Intelligence to augment human intelligence
Few technologies have managed to promise more and deliver less than AI. But before you throw the baby out with the bathwater, consider that when used properly, AI can leverage the productivity of employees by a factor of 5X or more by allowing them to devote less time to data review and more time responding to anomalies in the data flagged by AI. One of the ways we do this is through the use of guided AI that is trained to look for specific data patterns along with multiple corroborating indicators as part of the Decision Support capabilities of System 1.

Merging process data and machinery data to make better decisions
Very few machinery problems can be solved when armed only with vibration data. Most practitioners will tell you that they spend considerable time gathering relevant process conditions to understand whether a machine is misbehaving due to the process or not. Non-digitized practices can be very tedious and often involve printing out process variable trends and manually comparing to similar printed plots of vibration trends. One of the beauties of a condition monitoring ecosystem such as System 1 is that it can seamlessly integrate process data so that it is always at your fingertips. Problems can be solved faster and genuine root causes identified because the interaction of process and machine can be properly understood.

Remote access
While the COVID-19 pandemic has resulted in very little that can be called “good”, it has forced the realization that people can be extremely productive when working from home. The key is that they need access to the data. When that data is paper-based and stored in filing cabinets at HQ, it is almost the same as “no data”. With the advent of data diodes, interoperable protocols such as OPC, and new aXess™ technology we are introducing in emerging platforms such as our Orbit 60 System, cybersecurity and generous access to data are no longer at odds with one another. Millions of dollars can be saved in not just elimination of travel-related costs, but the time spent getting there and back.

More efficient manual data collection
In earlier steps, we discussed how wireless and wired online systems are eliminating the need to manually collect data from assets that are either inaccessible or that warrant more frequent collection intervals than practical with a portable route-based program. But there are still hundreds or even thousands of assets in large facilities that will be appropriately addressed by manual data collection. So, it is unlikely that we will see the complete elimination of portable programs in our lifetime. Since manual data collection is part of the landscape for the foreseeable future, recent advances in digital technology have liberated some of the restrictions that existed since such portable instruments made their debut in the mid-1980s.

The first is the de-coupling of the data collection device from the user interface. In our 200-series SCOUT and COMMTEST data collectors, Bluetooth is used to wirelessly tether the hip-mounted data acquisition unit to any Android-based handheld device that serves as the user interface. Many companies have standardized on Android-based handhelds used for other purposes and this allows those same devices to be used with their route-based data collection rounds rather than buying a completely different purpose-built device just for vibration. Even for companies that aren’t already using Android handhelds, this approach provides a level of freedom previously absent in the industry and allows a device initially used for vibration to be used for other purposes as well such as acoustic measurements, thermography, replacement of “clipboard” logs by process operators, etc.
The second is the elimination of cable-based tethering to upload and download data from the collection device. While cable-based transfer is still supported, it is now also possible to use a range of wireless technologies to move data from a server to the collection instrument and vice-versa. Examples include WiFi, Bluetooth, cellular networks, and others. This eliminates the need to go back to your desk or other “hardwired” access point to upload your collected data or to download new route information to the collector. Walking down the plant to collect data can be taxing enough without having to make extra trips to/from your desk.

Enabling fixed equipment monitoring
Many people associate their condition monitoring platform with only rotating / reciprocating machinery – not fixed equipment. However, one US refinery estimates that their maintenance and inspection spend on fixed equipment is 10X more than that on rotating / reciprocating equipment. A separate blog provides a more in-depth exploration of this topic, but suffice to say that through the use of basic process variables, a better job can be done to monitor this type of equipment including piping, valves, heat exchangers, field instruments, vessels, etc.

System 1 is a highly capable platform for collecting the process data associated with these assets, trending it, alarming on those trends, and even developing special rules that flag anomalies and alert operators to problems before they progress.
Conventional wisdom asserts that fixed equipment wears at a uniform rate, and thus inspection intervals are the best way to determine condition. Practitioners, however, will tell you that fixed equipment is also subject to “event-based” wear. For example, a pipe wall may wear uniformly for years, but during a single process upset where the composition of what flows through the pipe changes, wear / corrosion can accumulate in a matter of minutes or hours that would normally take years. A massive pipe rupture at the same refinery mentioned above resulted in a fire costing a hundred million USD. And, it was traceable to an event similar to the one described above. Uniform wear would not have suggested an impeding disaster. However, careful attention to changes in the process fluid would have highlighted an event requiring attention due to the potential for accelerated wear and corrosion.
With the advent of “smart” devices like transmitters and valves, considerable supplementary information is available beyond what would be present in the basic 4-20mA analog signal. WirlessHART and ISA100 wireless, for example, superimposes a rich data set of device information on top of the basic process variable information. Examples might include the number of valve strokes over time, the cumulative valve stem travel, the presence of valve “hunting” as the positioner oscillates, etc. All of this can be gathered, trended, and alarmed within System 1 to assess health of these devices. A different platform is not required; System 1 can be leveraged to encompass both rotating and fixed assets.

Reduction of required interfaces
When you have disparate software platforms as part of a plantwide ecosystem, each one represents a “mouth to feed” in terms of interfaces. Interfaces are required for one system to exchange data with another – such as the condition monitoring software to exchange data with the DCS. System 1 represents a single interface to your process control environment (or process historian) where process data resides.

While Modbus over Ethernet is the “go-to” protocol for many customers – and is fully supported by System 1 – we also embrace OPC methods of interchange, including the legacy OPC-DA and OPC-AE, but also the new OPC-UA protocol which combines the functionality of OPC-DA (Data Access), OPC-AE (Alarms & Events), and OPC-HDA (Historical Data Access) into a single Universal Access mechanism for fewer interfaces and more functionality. Because System 1 unifies all the monitoring devices in your plant, it represents only a single interface to establish and maintain.
But there is an additional way that we are improving our interface environment. It is something we call Orbit ConneX™ technology that we will be rolling out in our Orbit 60 platform in early 2022. When released, we’ll be devoting a blog topic all of its own to this innovative interface. Historically, vibration monitors were connected to the process control system by means of analog recorder outputs (usually 4-20mA proportional signals) and relay contacts to annunciate alarms and current values to operators on either panel boards or DCS consoles. With the introduction of Modbus and other digital protocols, the wiring was reduced to a single cable, but there was still a minimum of one cable to bring everything into the DCS and a separate cable to bring everything out of the DCS and into the condition monitoring software so it had access to process variables.
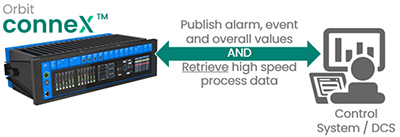
With Orbit ConneX technology, we have made a simple yet profound step forward: introduction of a bi-directional interface so that data from the condition monitoring ecosystem can be sent to the process control system (PCS) while simultaneously receiving data from the PCS into the condition monitoring environment. This bi-directional communications gateway will be first available in the Orbit 60 platform. We will have more to say about this in early 2022 with examples of how it simplifies your world and reduces cost.

Flight recorder capabilities
Online monitoring hardware has historically assumed that a connection to the condition monitoring server is persistent. As such, most were developed with very little (if any) buffering capabilities. Systems such as Trendmaster, vbOnline Pro, 3500, and Orbit 60 contain a “flight recorder” capability that can capture event data while tolerating intermittent connections to a server. vbOnline Pro, for example, can tolerate communication outages of up to 8 hours without losing any data. For Trendmaster, this can be measured in days rather than hours. The amount of time buffered is actually a function of memory capacity – not time – and will vary with channel count and channel complexity.

Such technology was simply not practical prior to digital signal processing and storage in memory. The introduction of this technology to online monitoring systems is relatively recent, pioneered in the last decade or so. When machine conditions are not changing, a gap in the time record is not as critical as when an “event” occurs, such as an alarm, a trip and subsequent coastdown, and even a restart (whether successful or not) by operators. Having all of that data available to troubleshoot the root cause can be indispensable.

Integrated performance monitoring

The payback on condition monitoring is often event-based; a single “save” can often pay for the entire monitoring system if process downtime is expensive enough, or the safety or environmental impacts consequential enough. Thermodynamic performance monitoring is distinctly different and easier to monetize because each hour that a machine runs with degrading efficiency can be directly converted to a hard cost – usually fuel or other energy consumption. When integrated performance monitoring is present in the condition monitoring system, rather than as a separate stand-alone application, a shared data repository can be used instead of creating yet another data silo. A shared visualization environment can also be used, along with a shared analytical environment – including Decision Support capabilities and AI augmentation. System 1 provides integrated performance monitoring, allowing both the mechanical and thermodynamic health of assets to be monitored.

Operator visibility
Historically, vibration monitoring systems were mounted in panels near the machine. Operators simply had no visibility other than perhaps annunciation when there was an alarm or trip. Later, many of these monitoring systems moved into the control room where they were visible to operators, but at the expense of extensive field wiring. With the advent of digital communications, the monitors could again be located outside the control room and information streamed to the DCS.
Today, however, a far richer data set is available to the DCS than previously and when Decision Support is added, truly “intelligent” alarms and advisories can be given to operators. When operators have the right machinery information available to them, they can avoid operating conditions that cause the asset to wear faster – such as cavitation on pumps and rough load zones on hydro turbines. This directly correlates to less downtime because the useful life of the asset can be optimized – with the survival of the asset balanced against the needs of the process and increased throughput.

Our Experts

Kim Murphy
Marketing Director
BIO
Exclusive leader, known for her strategic leadership and direction for product development, applications support, new product introduction, project funding, product cost out, branding and overall strategy within the business.