

A Roadmap for Digital Transformation of Hydro Condition Monitoring

Introduction
Digital Transformation is a key topic amongst hydro and other power generation operators as they seek to reduce maintenance and repair costs and optimize asset availability. Bently Nevada is developing an ecosystem of solutions and toolsets for operators of large fleets of assets that provide data and analytic insights to enable a high level of industrial asset management. The benefits of effective reliability programs include consistent and proactive failure-mode detection, reduced maintenance and repair costs, improved asset availability, and extended operational life.
Diverse influences continue to shape how hydroelectric assets are operated and maintained. While many hydroelectric projects were driven by the need for flood control and water supply, those purposes have since been modulated by environmental concerns such as water temperature and aeration. Additionally, ancillary and grid support services (frequency control, black start capability, spinning inertia, etc.) have become more important for those grids increasingly populated by inverter-supplied power sources. Solar and wind power require backup from reliable conventional power generation, and hydro power has risen to the daily challenge of a steepening evening ramp rate as solar power quickly drops off the grid. Pump storage hydro is likely to meet an increased need to balance fluctuations in other renewable sources by serving as a “water battery.”1 A more recent development is electrolysis plants for hydrogen production, which can level the electrical demand on hydro generating units and allow more efficient operation and water use.
Although versatility could be considered a virtue, it usually comes at a cost. A recent study conducted by the US Department of Energy points out that these changes “may also present additional costs, such as accelerated machine wear and tear due to frequent cycling and start-stop operations” that “require new research into technology innovation, data development, analytical tools, and operational strategies to preserve and enable important hydropower capabilities and contributions into the future.”2 One example of facing into this need is the European Union’s Hydropower Extending Power System Flexibility project, or XFLEX, which seeks to demonstrate how technology enhancements and improvements to conventional and pump storage hydropower can provide flexibility via ancillary services in support of decarbonization and grid stability.3 Notably, one aim of XFLEX is the use of a key performance indicators matrix to capture improvements in operations and maintenance.
It’s clear that market, environmental, operational, and technology changes are driving a shift toward digitization in hydropower. What has also emerged is a roadmap for the digital transformation of hydro condition monitoring, as seen in Figure 1. You may recognize some of these phases because they reflect ground you’ve already covered; the road to digitization is a gradual process dependent upon organizational will and wherewithal. This article provides an overview of what each phase of the digitization journey can look like, and some tips on how to navigate next steps.
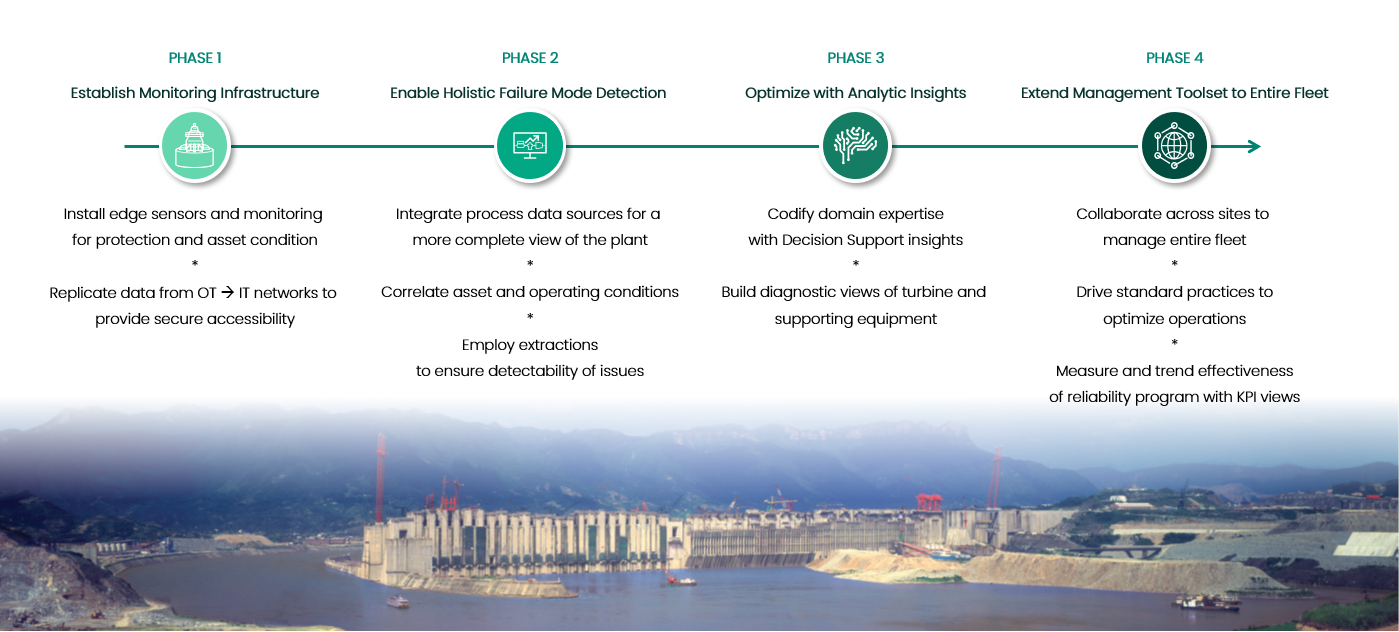
Phase 1 - Establish Monitoring Infrastructure
The “Achilles heel” of any monitoring system is proper selection and installation of the sensors. One unique challenge to instrumenting hydroelectric units is the variety in turbine type, unit construction, operating speed and head, orientation (horizontal or vertical), and other variables. However, a common theme is the need for shaft vibration monitoring, as codified in several industry standards. One of these standards, ISO Standard 13373-74, highlights two fundamental vibration measurements: shaft relative vibration and bearing housing vibration. Shaft relative vibration consists of two non-contacting proximity probes mounted 90 degrees apart at each guide bearing for measuring shaft relative displacement. In some applications, these are complemented by bearing housing or support vibration measurements using accelerometers or velocity transducers. A Keyphasor® probe provides a once-per-turn reference or indexing mark for these and other vibration sensors on the unit so that phase of vibration can supplement the amplitude measurements for additional valuable diagnostic information.
The generator, especially on larger units, is subject to centrifugal, electrical, and thermal forces and cycling that make it one, if not the primary area, of condition monitoring concern. A fundamental measurement for generators is air gap between the rotor and stator. A set of equally-spaced sensors – one set at the top of the stator and a second set on the bottom of tall stators – can provide not only air gap values around the full circumference, but also values for circularity and concentricity per methods described in a set of standards published by CEATI International5.
Besides mechanical and electrical effects, the fluid forces on the runner can be an area that warrants monitoring. Indirect measurements are most often done using vibration and dynamic pressure sensors. Bently Nevada’s 350300 Dynamic Pressure sensor can monitor both static and dynamic (or pulsation) pressures.
These are specific examples, but other additional fundamental measurements comprise a basic set of sensors for a typical machine, and still others can be added for specific or corroborating measurements. Whether basic or supplementary, each sensor represents one or more types of failure mode detection that drives how each machine is instrumented. Figure 2 illustrates the most common measurements along with some of the corresponding malfunctions.
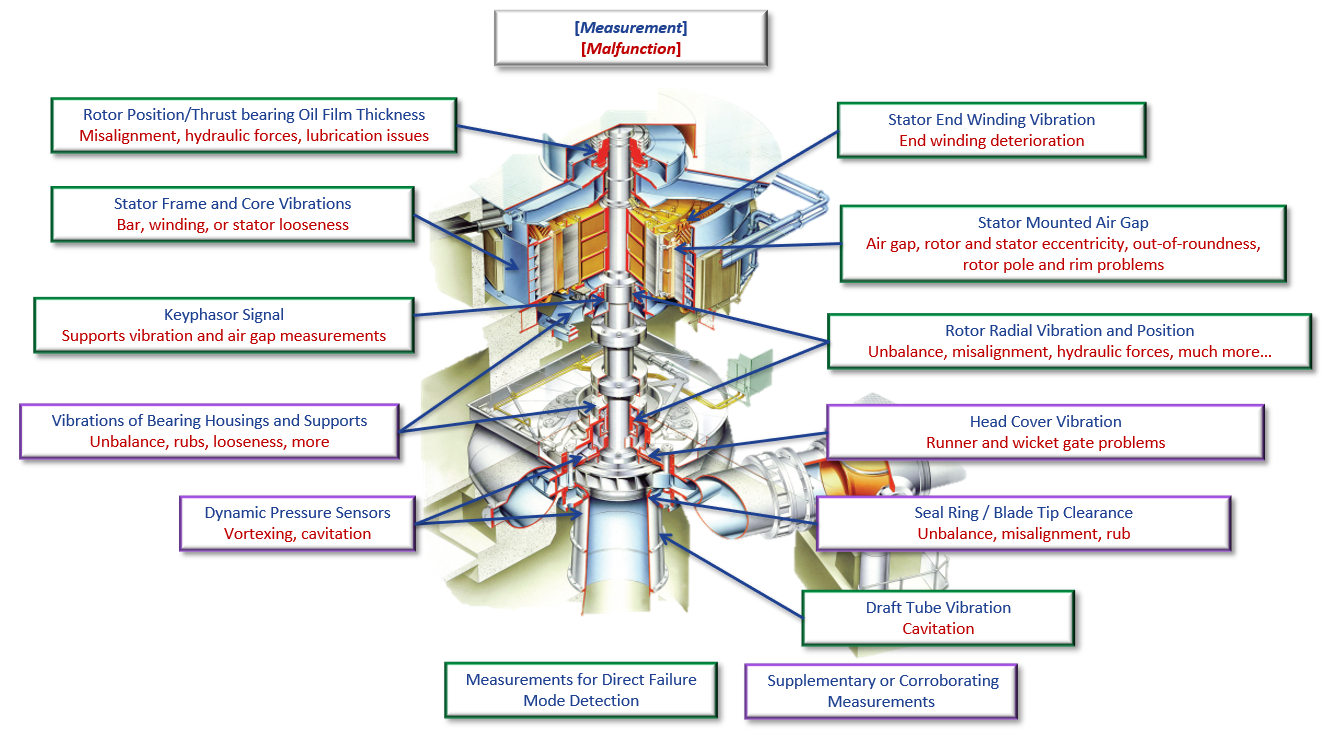
Any sensor and location selection is best determined by the guidance of applicable standards, manufacturer experience and recommendation, operation and maintenance history, and the user’s monitoring objectives. Not to be underestimated is the value of being prepared to detect the unknown and unanticipated; a comprehensive “picture” of the overall health of the machine increases with the variety and coverage of sensors. Optimizing this cost/benefit balance becomes a matter of you and your organization’s circumstances and preferences.
The transducers usually require conditioned electrical power and their output signals must be sampled at appropriate frequencies and intervals corresponding to the purpose of each measurement. Additionally, transducer and signal validity need to be monitored and indicated to other parts of the system. Bently Nevada’s rack-based 3500 System provides the widest range of capabilities for hydro units. The 2300 is a general-purpose monitor that has been used on small hydro units. Orbit 60, Bently Nevada’s next generation of continuous monitoring, represents state-of-the-art technology, increased flexibility, and onboard cyber-security features. Any of these provide continuous monitoring and include two levels of hardware alarms per channel. In some cases where no protection is needed, such as for auxiliary equipment, wired and wireless systems are also available.
A common denominator is the ability to connect to Bently Nevada’s System 1 Condition Monitoring and Diagnostic platform, which not only manages a data collection path separate from the protection function but also serves as a data historian and display interface that performs various valuable functions.
In this digitally networked age, data needs to flow over local and wide-area networks, from monitoring hardware to computers and from one computer to the next. Increased connectivity demands greater responsibility for data and operational security. The need is even more important for hydro units, many of which are located remotely and sometimes partially manned or totally unmanned. A 2018 Powerline magazine article made the case that hydroelectric generating assets are more conducive to remote operation than thermal or gas plants, and therefore better candidates for digitization.6To securely bridge these gaps, Bently Nevada incorporated data replication into the System 1 Evolution product architecture, providing a cyber-secure solution to getting data from the control room all the way to a central monitoring center in another state or region. At the appropriate level, System 1’s OPC UA data export capabilities also allow data to be sent to data storage clouds or lakes.
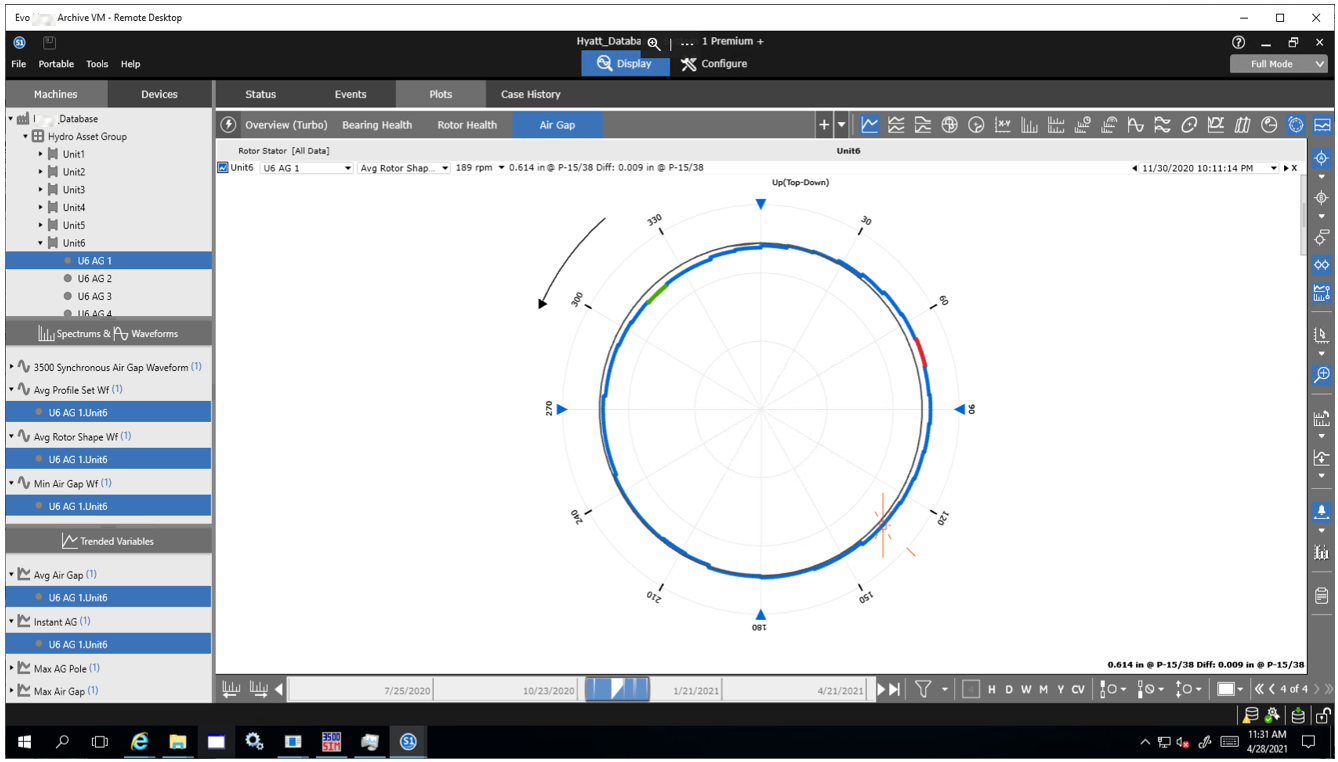
No matter where the end user of the data is located, it’s important they can view the data in meaningful formats that provide a clear picture of various aspects of the condition of the hydroelectric generating asset. Figure 3 is a rotor shape plot in the System 1 plot display, generated using air gap sensors:
- The pane to the left of the plot space is a hierarchy were hydro unit, measurement, and sample type are selected
- The upper-right hand margin contains icons for each graphical plot type
- The right-hand margin contains cursor and plot synchronization and similar selections
- The bottom margin shows where the data is located in a historical timeline window and includes buttons to select the plot timeframe, number of plots per page and plot display order or grouping.
Having this information visible and readily accessible makes for user-friendly and intuitive navigation, while providing powerful versatility in how to view the data.
In addition to simple bar graph displays, a full complement of diagnostic plots is provided, including polar, orbit, waveform, spectrum, waterfall, air gap, X-Y, multivariable trend, bode and amplitude phase time, and others. Alarms are color-coded for easy status recognition, including yellow and red markers representing the alert and danger alarm thresholds set in the monitoring modules. Additional levels of alarms can also be set in the software for earlier change detection.
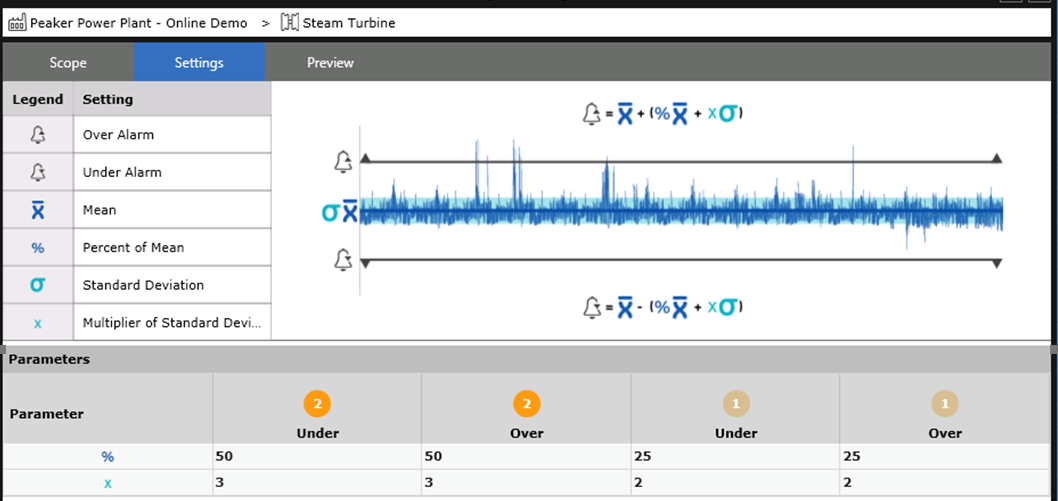
One frequently asked question is where to set alarm levels. In the absence of OEM recommendations, a statistical alarm feature (see Figure 4) allows one to test proposed software setpoints on a selectable range of historical data and to adjust them until the desired degree of sensitivity to deviations in data has been achieved.
Once an alarm occurs, the data can be examined to determine not only how the event occurred and evolved, but also how the machine behaved through it and if any damage or deterioration occurred. To facilitate these evaluations, some continuous monitoring systems have data buffers for each monitoring channel that serve as a moving window of high-resolution measurements and full waveforms. The contents of these buffers can be temporarily frozen upon the occurrence of a hardware alarm and then uploaded for storage in the System 1 software. This data set, which starts ten minutes before and continues through to one minute following the alarm actuation, focuses the fastest sampling 20 seconds before to ten seconds after the alarm. This provides a concentrated amount of data where it is most needed.
While there are many other features of a condition monitoring software application, these deliver a sampling of what is involved in the first phase of your digitization journey.
Phase 2 - Enable Holistic Failure Mode Detection
The second phase of digital transformation involves expanding our picture of asset condition to include the operating factors that affect machine behavior. This includes adding operational and process data from SCADA, the unit control system, or a historian so we can correlate them with the machine condition data in the same software platform. It also can include parameters called “extractions” that combine multiple parameters to arrive at a simpler, yet more meaningful condition indicator.
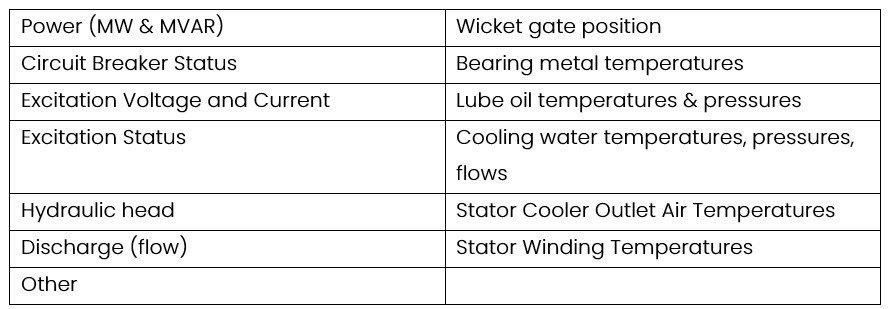
The ISO 13373-7 standard mentioned earlier points out that machine operating parameters have an influence on machine vibration characteristics. Table 1 presents a list of some key parameters that can be imported into the condition monitoring system from other powerhouse systems. It is important to differentiate changes in behavior due to operating condition from those caused by malfunctions, not only to avoid false diagnoses but also to detect a developing problem more reliably. Some of these parameters, such as lube oil and cooling water temperatures, can in themselves be indicators of problems, like cooler fouling or a malfunctioning temperature control valve. One other use of these parameters is to identify transient conditions, such as speed changes, excitation, or breaker close, that result in distinct changes in vibration or position.
We’ve discussed how alarm and transient data collection is important, but it is also desirable to tag the data to categorize it according to ranges of operating conditions. This can start at the monitoring system level. Multiple modes can be defined in a 3500 monitor and assigned their corresponding rotation direction and unique alarm set points and time delays. These modes can then translate into machine states in the condition monitoring software, where appropriate data storage rates and alarm schemes can be independently configured. Additional machine states can be defined, triggered by any of the data imported from the SCADA or control system. The software can also filter data according to machine state in the trends and diagnostic plots.
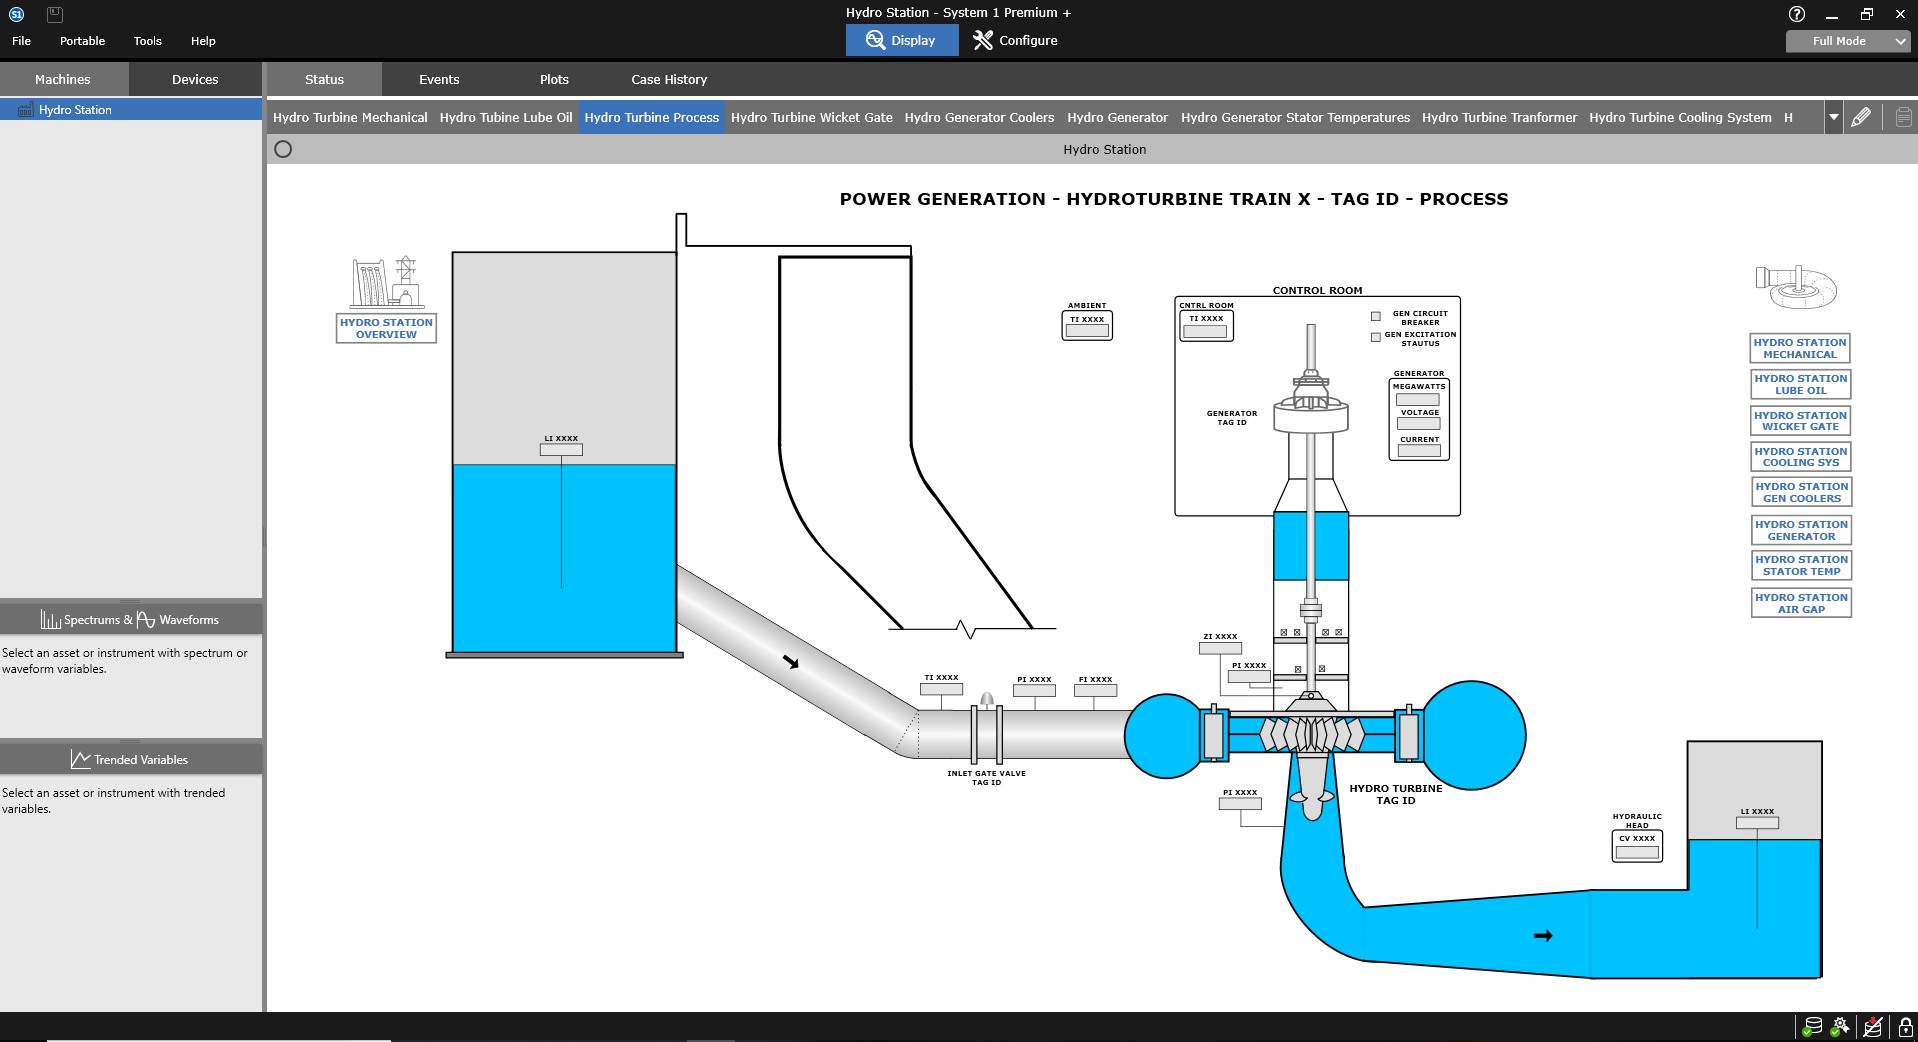
A basic benefit of integrating machine and process data is on-screen correlation of values. One way this is done is through HMI screens of various aspects of the process and assets. Figure 5 shows a System 1 default HMI template of the overall hydroelectric process. These templates can be customized by the user according to each plant’s unique layout and measurements.
Another very useful application of integrating machine and process data is correlating accelerometers and/or dynamic pressures on the draft tube, head cover, and wicket gates with head, flow, and MW load. This combination of measurements has been used to map cavitation and Rheingans Influence across a full range of conditions to optimize the safe operating envelope, and air injection locations and flow rates.
As we approach the next phase of digitization, one final concept worth noting is extractions, which combine multiple machine and/or process measurements or states to create a new value to reduce an aspect of machine condition into a simpler but more meaningful value. Often, the value is a unitless ratio of measured versus allowable or expected value. Two benefits of extractions are: they can reduce the bandwidth of data transferred to a cloud-based diagnostic system, and, as a ratio, they are more conducive to use in artificial intelligence modeling techniques. For example, an extraction that could be used as an input to unit verticality or alignment diagnostics is “Largest Bearing Metal Temperature Difference Ratio”, or the maximum temperature differential between thrust bearing pads compared to a maximum configured bearing temperature differential. Extractions are not diagnostics of a failure mode but can become one of the inputs to diagnostic rules for specific malfunctions, which leads us to the next phase of the digitization journey.
Phase 3 - Optimize with Analytic Insights
Optimizing with analytic insights includes two primary topics: leveraging Decision Support analytics to codify domain expertise and employing diagnostic HMI views to understand the relationships between the process and machines on ongoing machine health. We will start by exploring Decision Support analytics.
Decision Support Developer
Decision Support Developer is a graphic, rule-building environment that enables hydro reliability engineers to take their experience of complex hydro failure modes and ”codify” them into rules that can be applied across multiple hydroelectric turbine generators across the fleet. It works in conjunction with System 1 to consume data as input and return rule results back into the System 1 database. These rules augment the reliability process through more targeted failure detection that may also recognize changes in machine state. Furthermore, Hydro operators can use Decision Support rules, also known as insights, to provide more consistent detection in plants with less experienced reliability engineers, while also future-proofing the organization against loss of expertise through retirements and other forms of attrition.
Figure 6 provides an example of a simple run and shows how it is constructed using the graphical rule-building interface of Decision Support Developer.
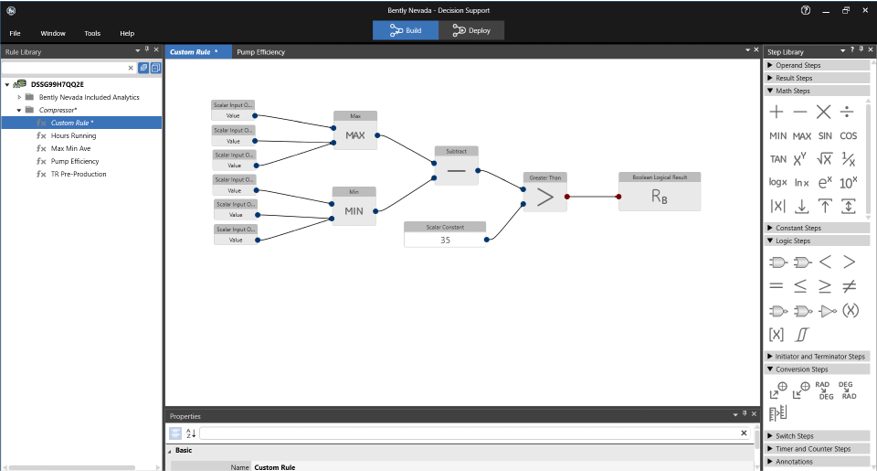
The environment allows multiple inputs from the process or vibration condition monitoring system to be combined into targeted analytic results, which can drive predictive insights into developing conditions that affect the health of the hydroelectric turbine generator and supporting equipment. When leveraged to its maximum potential, Decision Support Developer rules can augment the detection of complex issues while reducing the number of ”nuisance” alarms generated by simpler analytic extractions that may not account for changes in machine operation.
Decision Support Developer includes common math, constant, initiator, terminator, conversion, switch, timer, and counter steps to support a broad set of analytics. A robust deployment environment simplifies deployment of these custom rules. Rules may be shared across the fleet to enable consistent detection.
Diagnostic HMI Views
The second enabler of analytic insight optimization is the ability to understand the complex relationships of hydroelectric turbine generators through diagnostic HMI views. This capability enables complex interactions between various systems and sub-systems to be visualized in the context of machine operation. An example of a diagnostic HMI of the hydroelectric process was shown previously in figure 5. Some additional sub-system views are shown in Figures 6a – 6g
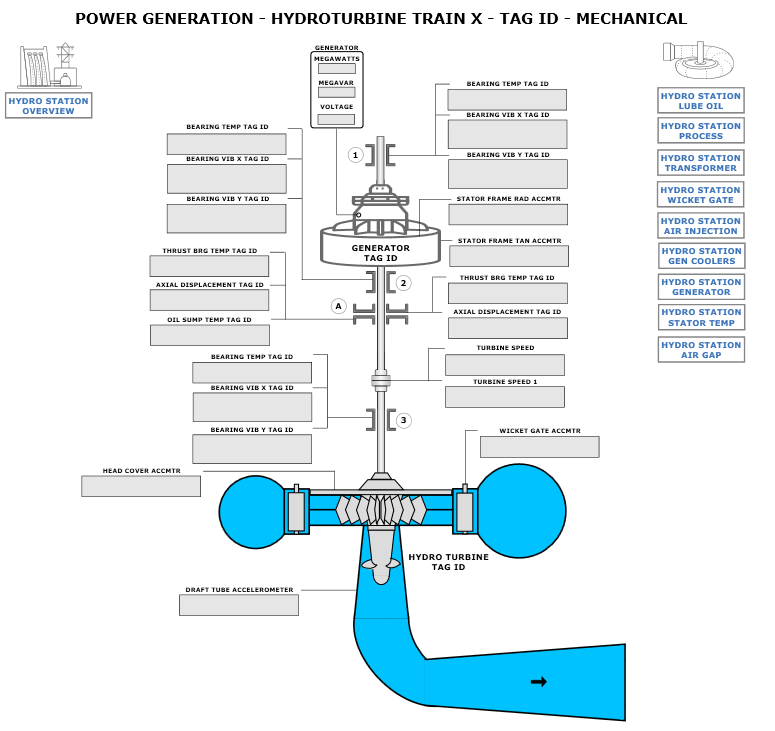
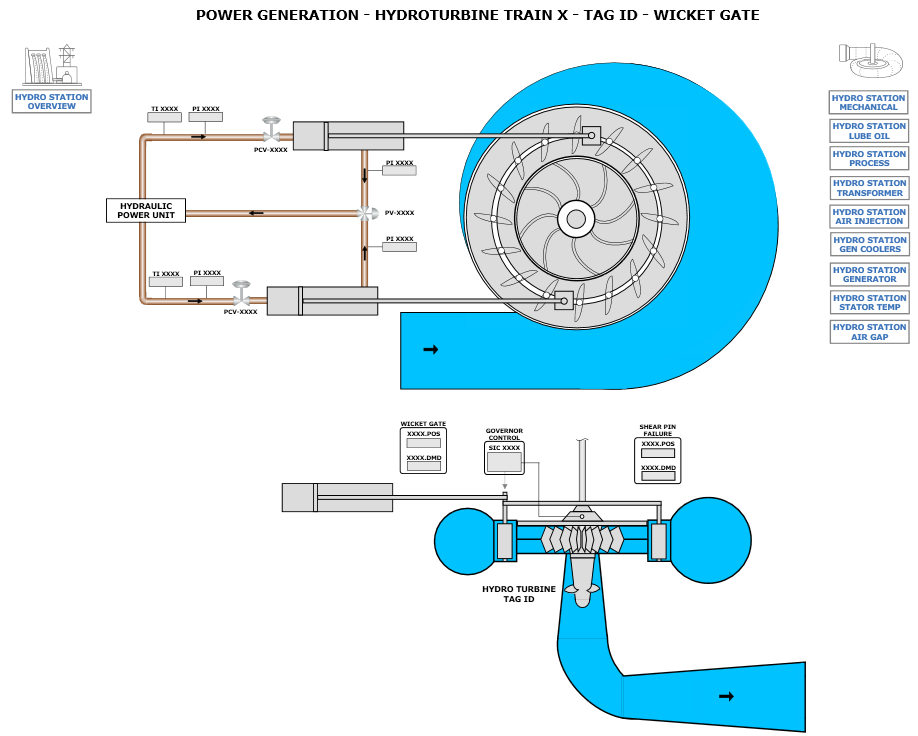
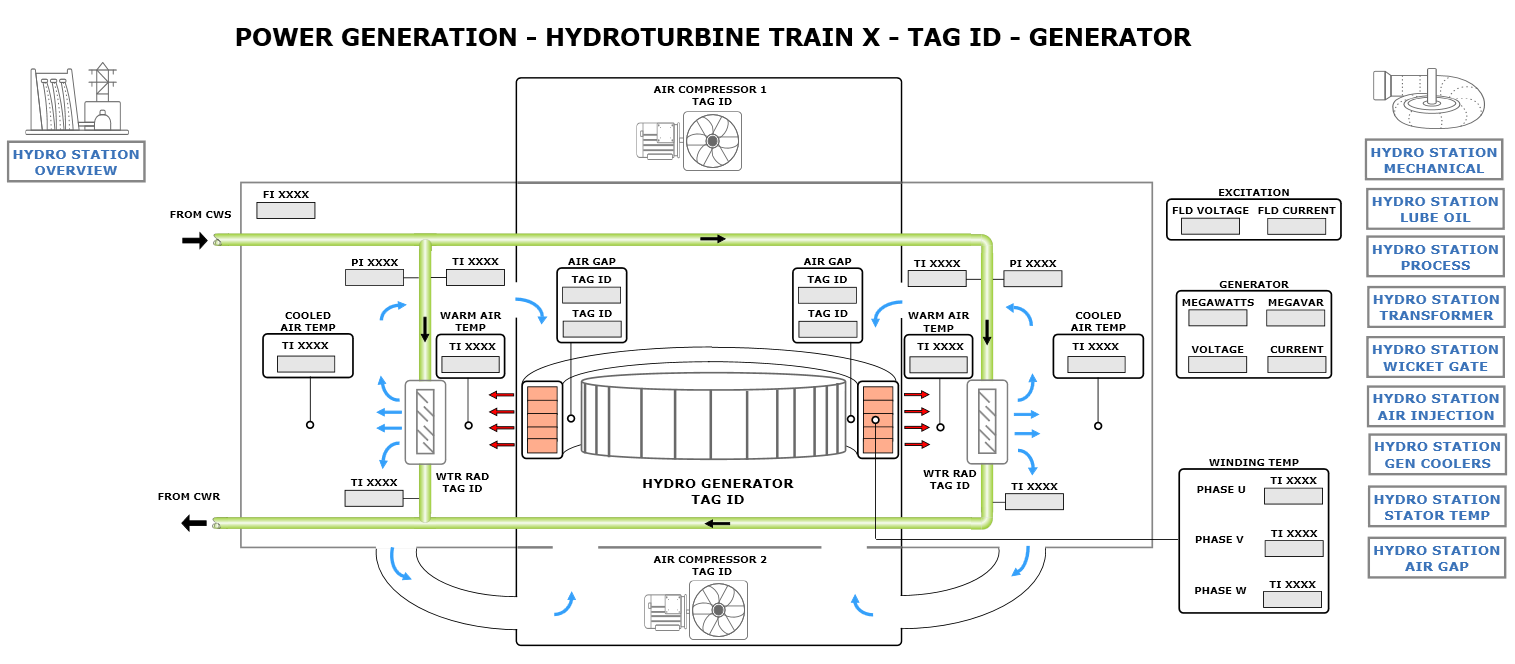
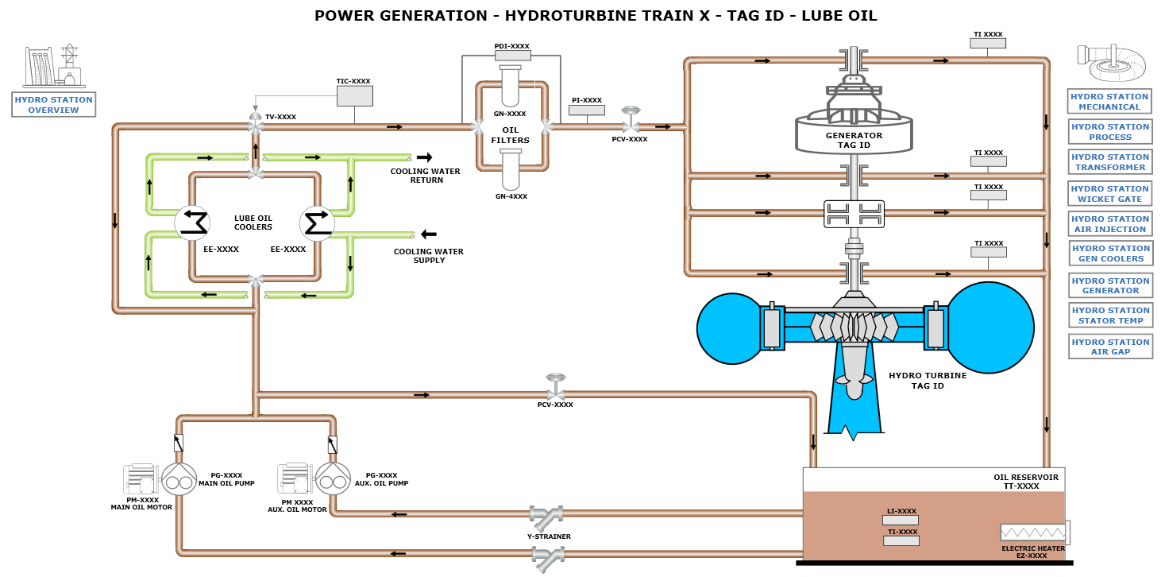
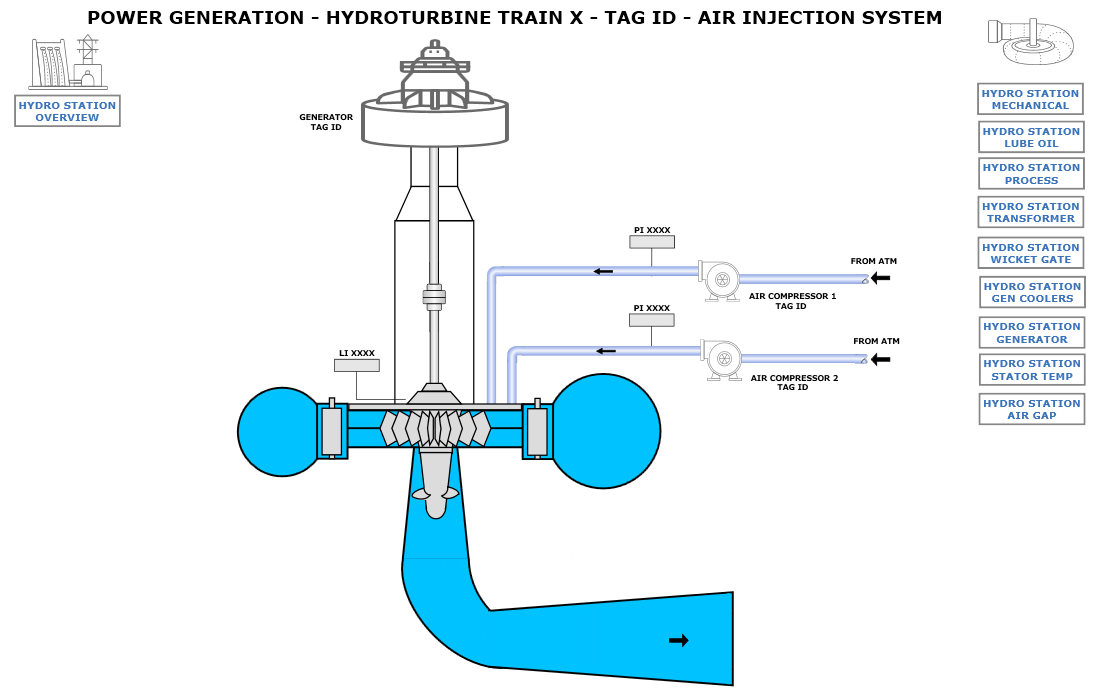
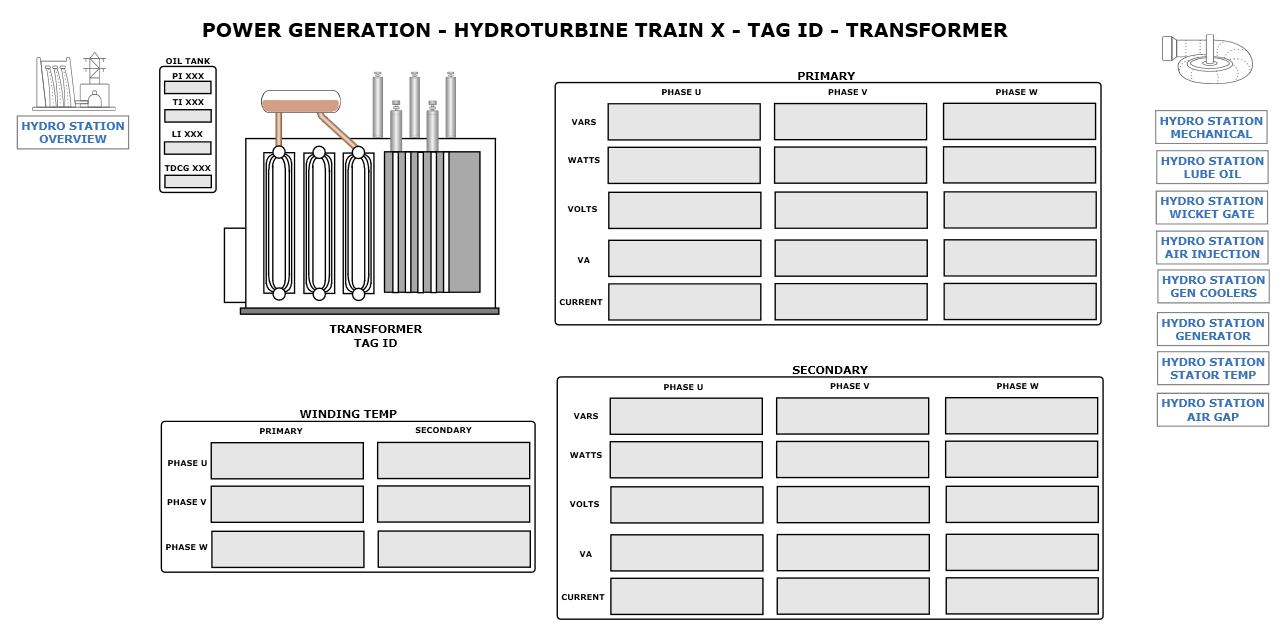
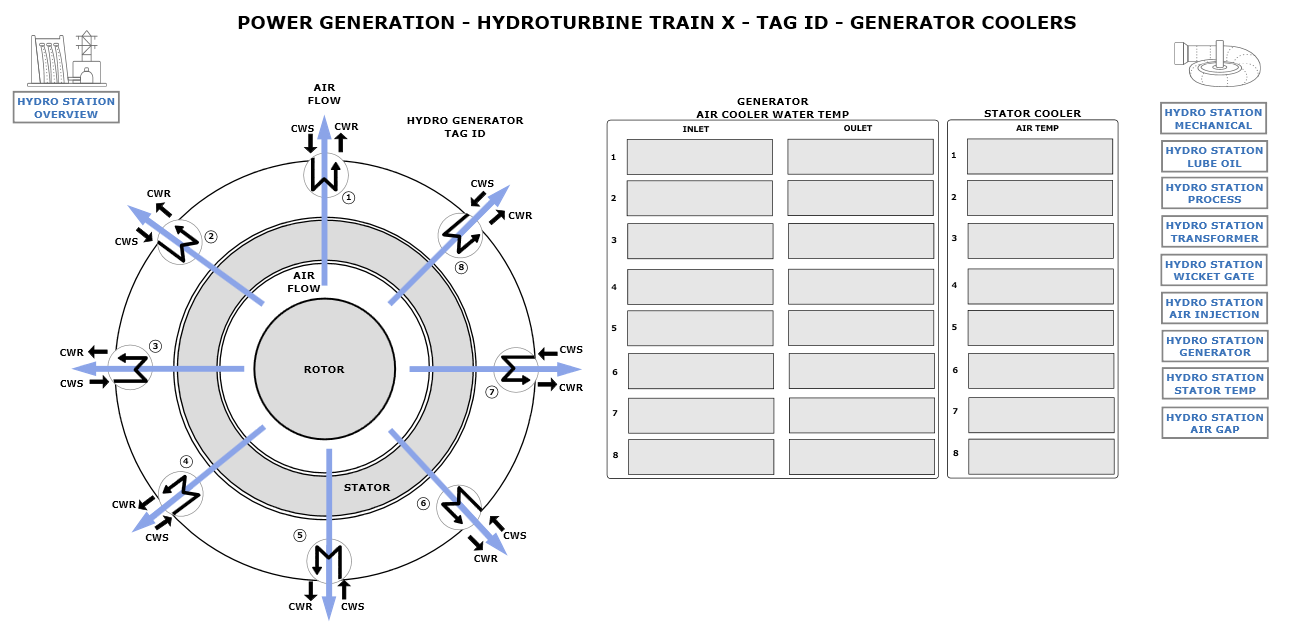
Visualizing these systems and sub-systems and including key measurements and calculated parameters provides insights into the interaction between process and machine behavior that helps improve the understanding of machine issues and how they may affect other parts of the hydroelectric turbine generator. These views enable faster root-cause detection through the visualization of alarm events in the form of colored component statuses. Measurements and parameters may be linked to alarms or Decision Support rules to provide real-time status of component health.
Phase 4 – Extend Management Toolsets to Entire Fleet
The fourth phase of digital transformation focuses on toolsets that enable more efficient workflows and management practices for a fleet of power generation sources. This can involve multiple types of electricity generation, including hydro, wind, fossil, nuclear, and concentrated solar power. These toolsets provide visibility into overall fleet health while enabling more efficient first-line analysis, centralized and collaborative case management as well as indicators into the effectiveness of reliability and maintenance activities through custom KPI views.
In the following sections, we will examine how System 1 Enterprise, a new fleet management software application being introduced by Bently Nevada in the fourth quarter of 2021, can enable more proactive asset management.
Key benefits of this application are its location on the business or enterprise view and its display capability via a web browser. This allows a broader audience of reliability and maintenance professionals as well as management and leadership to access and visualize asset priority without requiring knowledge and access to advanced toolsets such as System 1.
Fleet and Process HMI Views
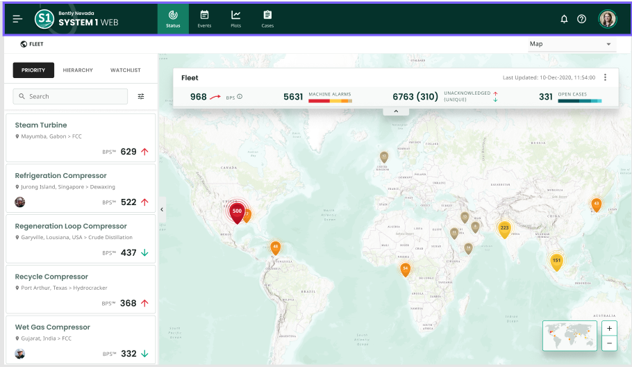
A key capability of System 1 Enterprise is its ability to visualize a fleet of assets overlaid on a map, which is a key component of the Status Workspace. The Status Workspace provides a quick reference for both reliability engineers and leadership to understand the health and priority of assets globally. The map view uses colors and priority KPIs to quickly indicate plants or assets with the highest risk and priority. Figure 7 depicts a map view of asset priority involving multiple sites and assets.
Once a high-risk site has been identified, the next step is to understand the alarm events that are driving the priority. This can be accomplished by clicking on the asset icon in the map view and following the hierarchy down to the plant process view, as shown in Figure 8.
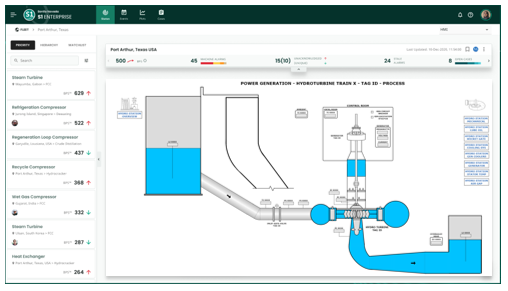
By navigating to the plant or process level, the affected system or sub-system can be easily visualized, and the parameter or distressed machine can be easily identified for further investigation.
Fleet-Level Work Prioritization through consolidated Event Lists
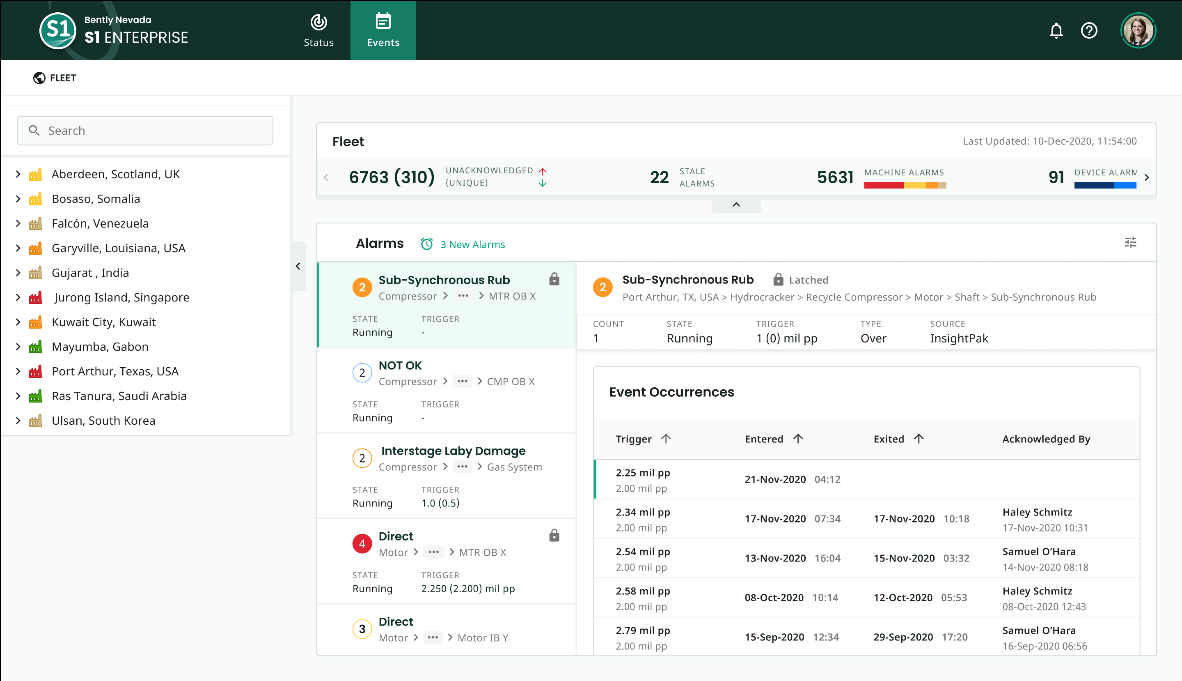
System 1 Enterprise provides a view of all events originating across the fleet through the use of an Events Workspace, which is automatically filtered based on hierarchy selection. A reliability engineer may begin their investigation into asset priority using either the map view or a fleet-level events view. Once a priority asset is identified, the Events Workspace enables a quick view of events that are contributing to the priority, including a historical view of the number and timing of assets entering and exiting each event type (i.e. Alarm). Figure 9 provides an example of an Events Workspace.
Consistent Workflows using Centralized Case Management Toolsets
Another important component of System 1 Enterprise is its ability to enable centralized and collaborative case management. This is achieved by importing alarm events and other case details from the individual System 1 databases and providing them in the central view, designed to enable stronger collaboration between site and central (or remote) reliability engineers, as well as other supporting services engineers who may be outside of an operator’s organization. Persons from various sites can identify issues, attach supporting evidence, then share or assign cases to others to support issue identification and track the case to a successful resolution. Automatic case notifications, using both email notifications and notifications within the System 1 Enterprise application, serve to inform other users of required actions. Figure 10 provides an example of a case notification that was received via an email from the System 1 Enterprise application.
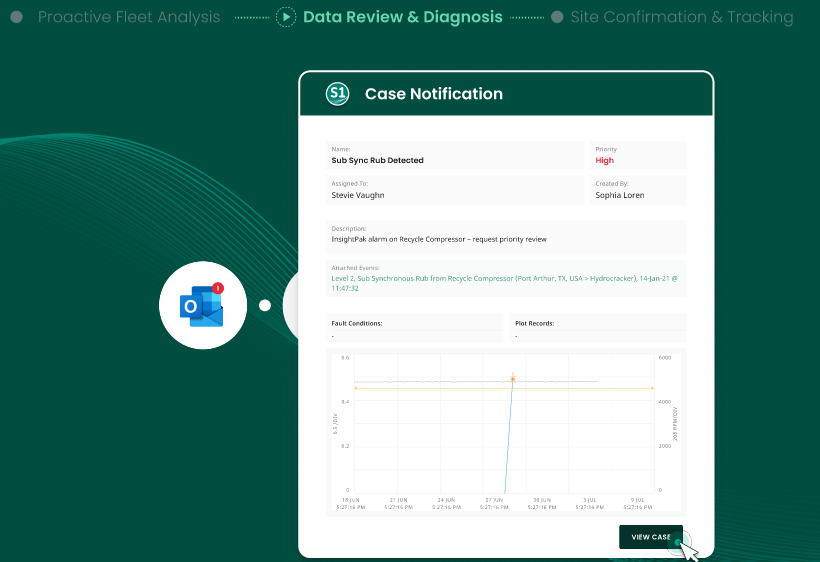
The notification contains a link to navigate the user to the System 1 Enterprise login page so they can quickly access the case and supporting information.
Comparing Assets Across the Fleet
A potential limitation of System 1’s desktop and server-based architecture could be that data is stored in individual databases, and it is not always easy to compare assets across databases. It can be particularly challenging for a reliability engineer to determine if a newly discovered issue with a hydroelectric turbine generator is also present in other turbines within the fleet. To simplify cross-database analysis, System 1 Enterprise will allow reliability engineers to compare assets from different databases in the Plotting Workspace using a basic set of plotting tools. When deeper analysis is required, the System 1 Enterprise application will allow a user to quickly access the full plotting and diagnostic tools available in System 1’s desktop application by way of a link embedded in the Plots Workspace. Figure 11 provides an example of a Plots Workspace, including a System 1 icon that links to the data sources associated with a particular asset in the fleet.
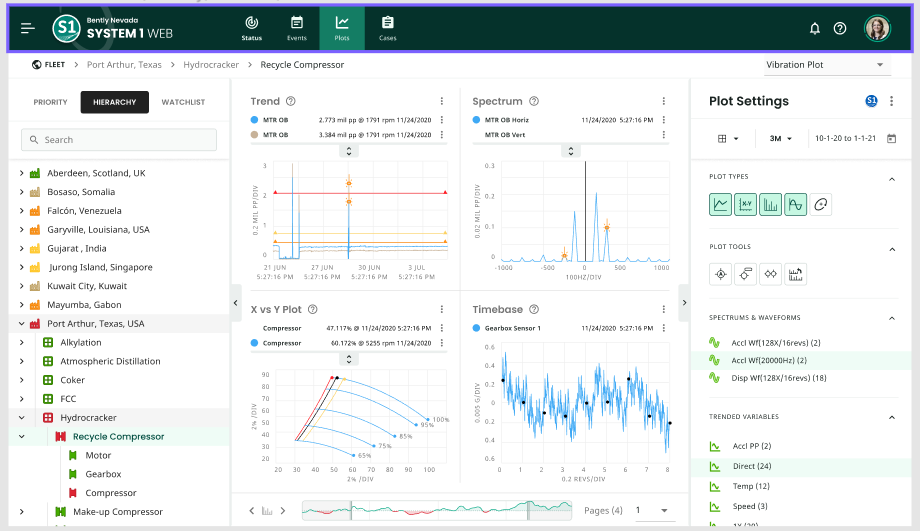
While the Plotting Workspace of System 1 Enterprise is not intended to replace the full toolsets of the System 1 desktop application, it can enable quicker issue identification for more common issues and reduce the time associated with a reliability engineer accessing the System 1 desktop application.
Tracking Effectiveness of Reliability Programs using KPI Views
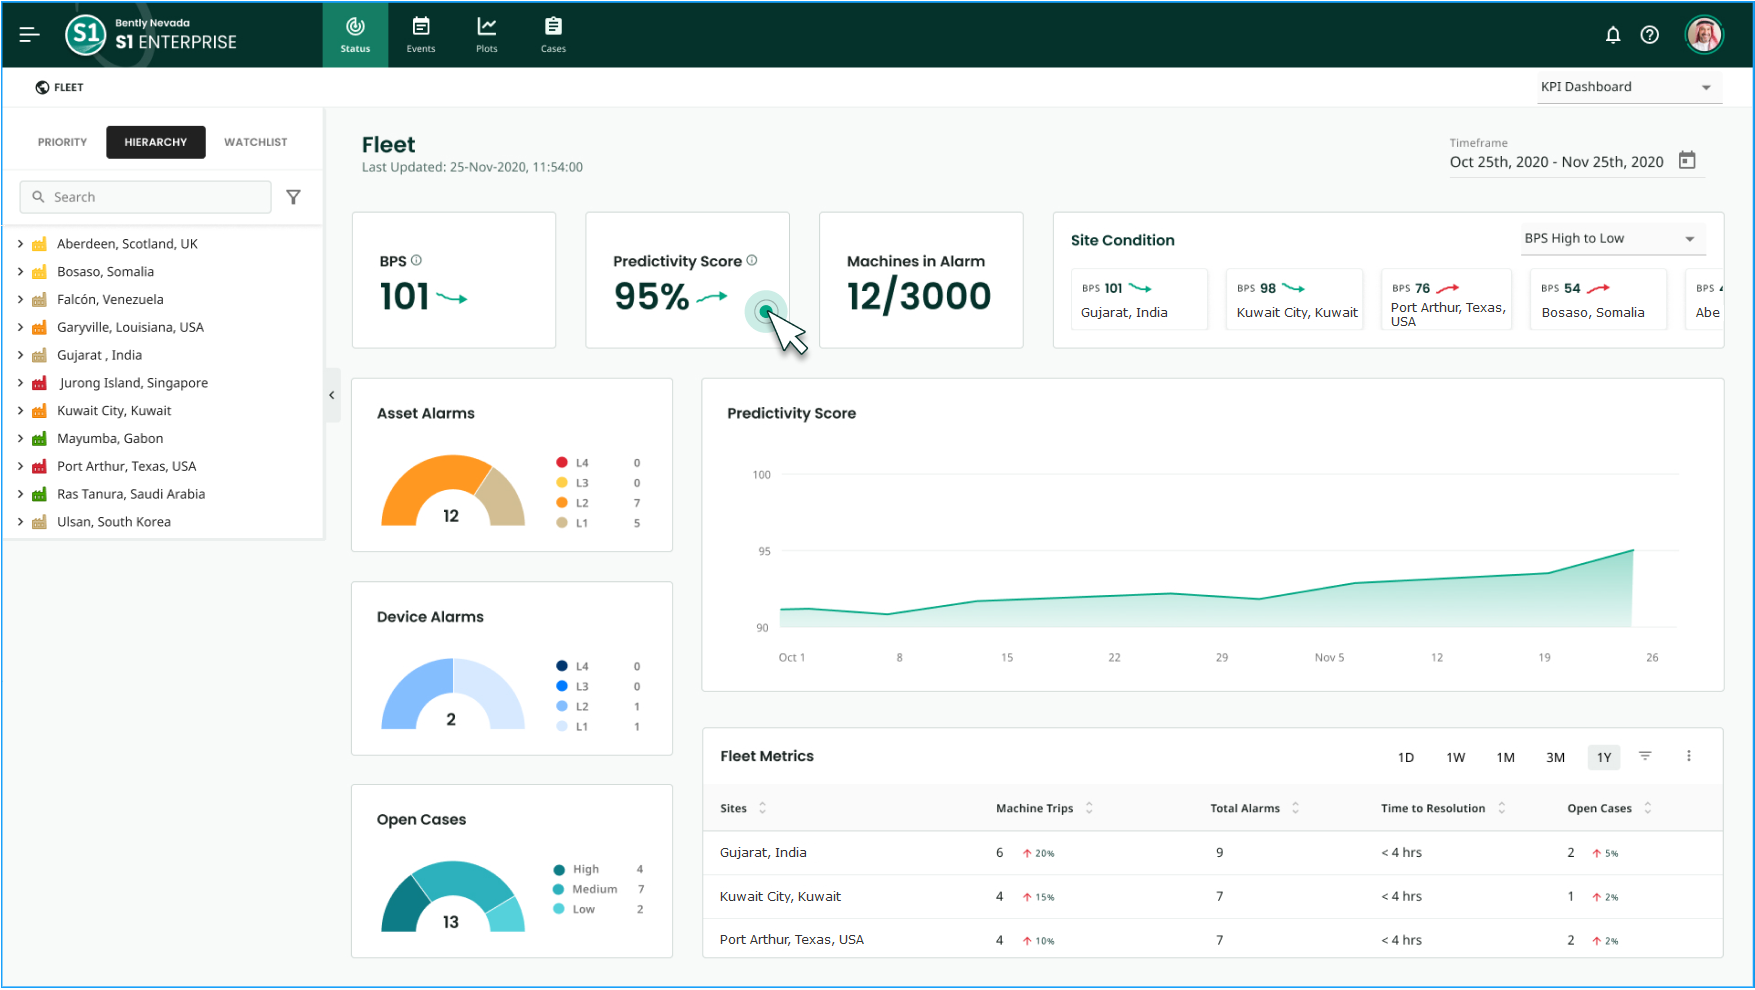
Next, let’s examine the KPI Workspace within System 1 Enterprise. This workspace, along with the Status Workspace, are intended to address the needs of stakeholders beyond those directly engaged in day-to-day reliability and diagnostic activities. This might include reliability program managers, maintenance teams, operations teams, digital transformation leaders, or others in the business who want to understand asset priority and risk. The KPI Workspace is intended to be customizable to an organization’s metrics. Sources of data can be System 1, process and control systems, and Enterprise Asset Management software. An example of a dashboard in the KPI Workspace is shown in Figure 12.
Connecting to Enterprise Asset Management Systems
Lastly, System 1 Enterprise is intended to be a central integration point into other applications that drive work within an organization. This could be SAP or similar Enterprise Asset Management software designed to organize and track the creation of work orders, ordering or allocation of parts, communication of work instructions or repair procedures, deployment of maintenance or repair resources, expense tracking, asset strategy optimization, and other activities related to asset operation and maintenance. The details of this integration will be explored in the future as the solutions matures.
Summary
In summary, Bently Nevada is committed to enabling digital transformation of hydro reliability programs through our monitoring infrastructure offering and software, which enables holistic failure mode detection, optimized analytic insights, and fleet management toolsets, designed as a cohesive ecosystem to transform the way we and our customers approach industrial asset management. The software applications and toolsets to achieve the first three phases of digital transformation are available today, and we are excited to introduce toolsets to enable the fourth phase by the end of 2021.
To learn more about digital transformation enablers from Bently Nevada, please contact your Bently Nevada salesperson or visit the System 1 website. We look forward to supporting the digital transformation of your hydro and other power generation operations.
References
- Rogner, M and Troja, N. (December 2018), The world’s water battery: Pumped hydropower storage and the clean energy transition. London, UK; International Hydropower Association
- HydroWIRES Initiative (January 2021), Hydropower Value Study: Current Status and Future Opportunities, PNNL-29226. Washington, D.C; U.S. Department of Energy Water Power Technologies Office, Page 9.
- XFLEX (November 2020), Report Summary, Flexibilities, Technologies, and Scenarios for Hydropower. Porto, Portugal; Hydro Institute for Systems and Computer Engineering, Technology and Science ((INESC TEC)
- ISO 13373-7:2017(E) (August 2017), Condition monitoring and diagnostics of machines — Vibration condition monitoring — Part 7: Diagnostic techniques for machine sets in hydraulic power generating and pump-storage plants (First Ed.). Geneva, Switzerland; International Standards Organization.
- CEATI HPLIG Project T122700 0381 (May 2015), Hydroelectric Turbine-Generator Units Guide for Erection Tolerances and Shaft System Alignment. Montreal, Canada: Centre for Energy Advancement through Technological Innovation (CEATI)
- Powerline.net (August 2018), Remote operations: Digitalisation enables seamless monitoring of NTPC’s Koldam hydro plant. Retrieved from https://powerline.net.in/2018/08/20/remote-operation/ on 6 May 2021.
Learn More about System 1
Prior Orbit Articles
System 1: Plant-Wide Monitoring with Clarity and Context
Celebrating 20 Years of System 1
Use Case: Thermodynamic Performance Monitoring
Upcoming System 1 Orbit Articles
The deep capabilities of the System 1 Platform will be explored in upcoming releases of Orbit magazine. Planned articles include:
Q3 2021 The System 1 Ecosystem – Connected Asset Management from Breadth to Depth
Q3 2021 Roll Monitoring in Pulp & Paper and Steel Manufacturing with System 1
Q4 2021 Introducing System 1 Enterprise
Q4 2021 System 1 Advanced Analytics
With many more to come…
Our Experts

Chris Kramm
Senior Product Manager - System 1
BIO
Chris is a Product Manager for System 1 at Bently Nevada. He has been involved in the introduction of new products and services for nearly fifteen years as a design engineer, project manager, product line manager, marketing manager and sales leader.

Mark Snyder
Senior Application Engineer – Renewables
BIO
Mark’s 30 years with Bently Nevada include sales and field application roles involving machine protection and condition monitoring for a broad spectrum of industries.