

How do I evaluate the echo amplitude of equivalent reflectors?
In this article:
- Equivalent Reflectors Standardize Flaw Evaluation: To overcome the challenge of interpreting diverse natural discontinuities, ultrasonic testing employs the concept of an "equivalent reflector"—a standardized, often disc-shaped, substitute that allows for consistent and operator-independent assessment of echo amplitudes.
- Echo Amplitude Relates to Distance and Reflector Area: For "small" discontinuities that fit within the sound beam, the reflected echo's amplitude in the far field is proportional to the square of the reflector's effective diameter and decreases with the square of the distance from the probe.
- DGS Diagrams Facilitate Reflector Sizing: DGS (Distance, Gain, Size) diagrams are essential tools that graphically link the transducer's characteristics, the instrument's gain setting, and the equivalent size of the reflector, enabling technicians to determine the discontinuity's approximate dimensions.
- Enhance Your Inspections with Waygate Technologies. Our solutions empower precise and efficient echo evaluation. Our modern digital ultrasonic flaw detectors integrate advanced software, automating what was once a manual process to significantly improve the efficiency and precision of your inspections.
In ultrasonic testing, evaluating indications from material discontinuities often poses a challenge due to the complex and variable nature of natural reflectors. Since the echo signals cannot always be interpreted with precision, the concept of the “equivalent reflector” has been introduced. This method offers a standardized way to compare echo amplitudes using substitute geometries, such as disc-shaped reflectors, to facilitate repeatable and operator-independent evaluations. In the following, we explore how equivalent reflectors are used, how their echo amplitudes are determined, and how tools such as DGS diagrams assist in the process.
The Role of the Equivalent Reflector in Ultrasonic Testing
Since the diverse reflection conditions that exist at natural reflectors in materials can never be clearly interpreted with the aid of the ultrasonic signal, a substitute has been introduced: the equivalent reflector! With the equivalent reflector the echo from a discontinuity can be traced to a clear source (substitute) independently of the operator. Such a substitute source is e. g. a disc- shaped reflector which, if lying perpendicularly on the acoustical axis of the sound beam, would deliver the same signal amplitude as the unknown natural reflector. This correlation is allowable as long as the natural reflector is one whose characteristics are similar to that of a circular surface.
That is the case for all discontinuities which represent “small reflectors” i. e. reflectors which do not extend beyond the limits of the sound beam in any direction. A behaviour characteristic similar to a circular disc is still present with an oblong reflector. The pre requirement that the reflector lies on the axis of the sound beam, is fulfilled for the manual test. There the probe is moved until the maximum indication is obtained from the reflector. Then the reflector lies on the acoustical axis. With the automatic test with fixed test paths, it is pure chance that a reflector lies on the acoustical axis of the sound beam. Here one may not simply operate with the disc-shaped equivalent reflector (equivalent reflector size = diameter of the disc) according to the signal amplitude (see chapter 13).
Distance Laws and Disc-Shaped Reflectors
The model of the disc-shaped reflector has the advantage that it can be easily experimented with and also be used for theoretical solutions. It is simple to note the distance laws in the far field for disc-shaped reflectors in single probe operation:
• If the distance between the probe and the reflector is increased the pressure of the approaching sound pulse decreases in proportion to the distance.
• The reflected sound pulse also loses pressure up to the receiver in proportion to the distance z, i. e. the echo amplitude is a function of the square of the distance z.
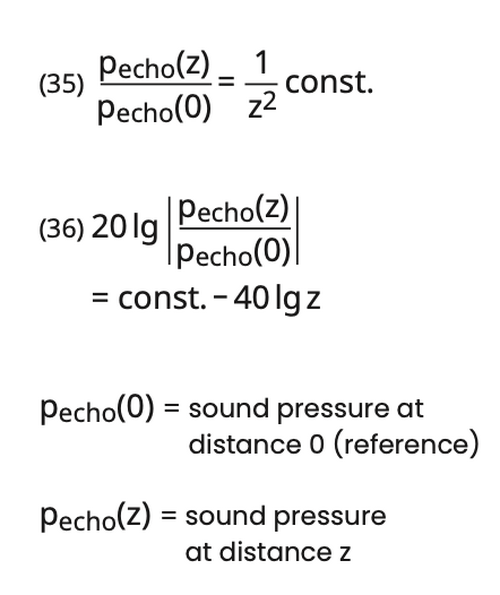
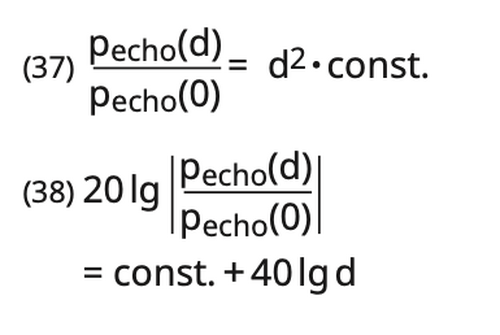
As the sound pressure of the reflected pulse is a function of the surface area of the reflector, which is the square of the diameter d, the echo amplitude in the far field is proportional to the square of the diameter:
Using DGS Diagrams to Determine Reflector Size
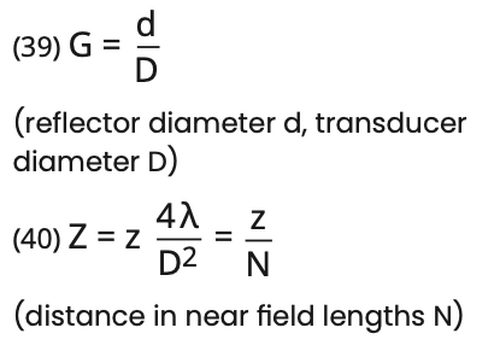
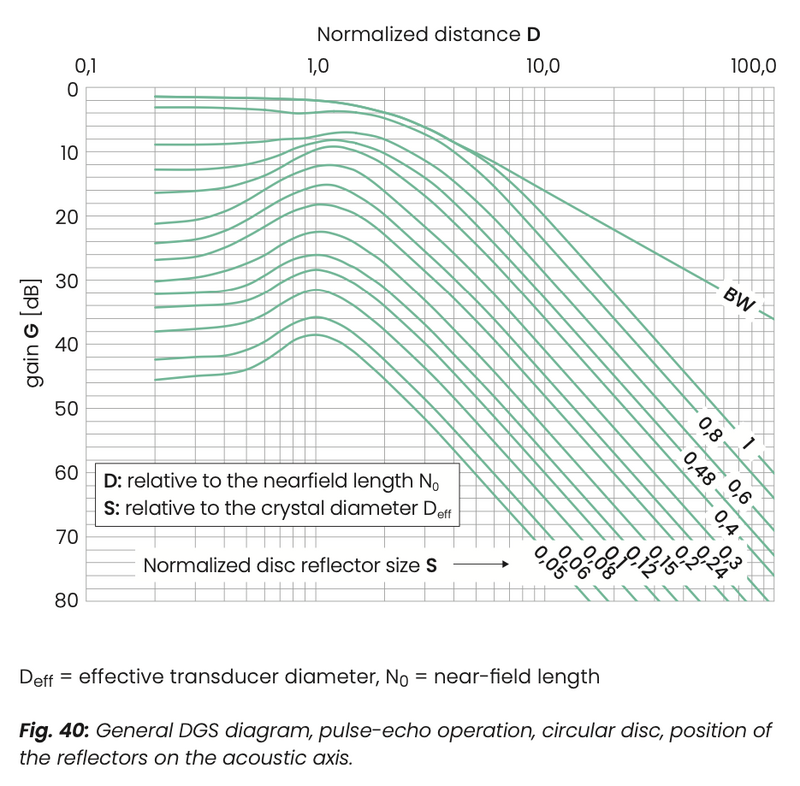
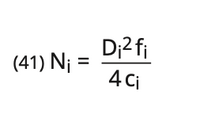
This generally applicable relationship between disc-shaped crystals (transducers) and disc-shaped reflectors depending upon the distance (D), gain (G) and size (S) is given in the DGS diagram (fig. 40). To obtain a general applicability the size of the reflector is normalised by:
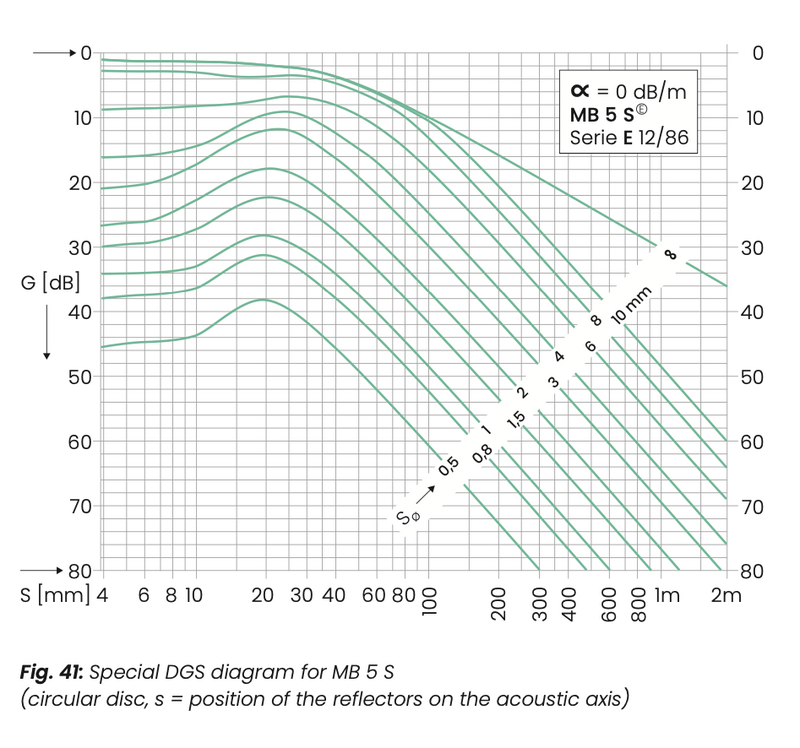
In order to save the conversion from standardised to absolute values, special DGS diagrams can be drawn for certain probes and certain materials, e. g. in the probe data sheets from Krautkrämer (such special diagrams only ever apply to one probe and one material). They represent a section of the general diagram (fig. 41).
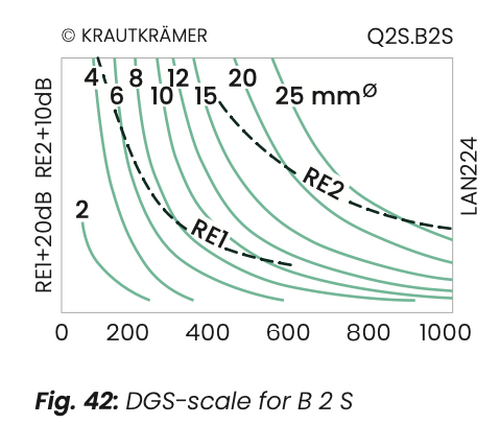
Testing is even easier with a DGS scale, which does not require any writing. It again represents a small section of the special DGS diagram. The curves of the circular discs (ERS = equivalent reflector size) are plotted on a double-linear scale which exactly fits to the screen of the instrument (fig. 42).
With modern, digital test devices, the DGS scales are history, as the curves for many probes are stored in the software of the devices.
Naturally DGS-diagrams cannot only be compiled for disc-shaped transducers and reflectors. They can be also produced for rectangular or cylindrical reflectors. DGS-diagrams are not limited to single probe operation. There are designs for dual probes (fig. 12) and for tandem operation using two probes (fig. 36).
Practical Considerations and Digital Advances
Before using a DGS-diagram or scale the effective data (actual data) of the probe must be known: diameter Di, frequency fi and near field length Ni.
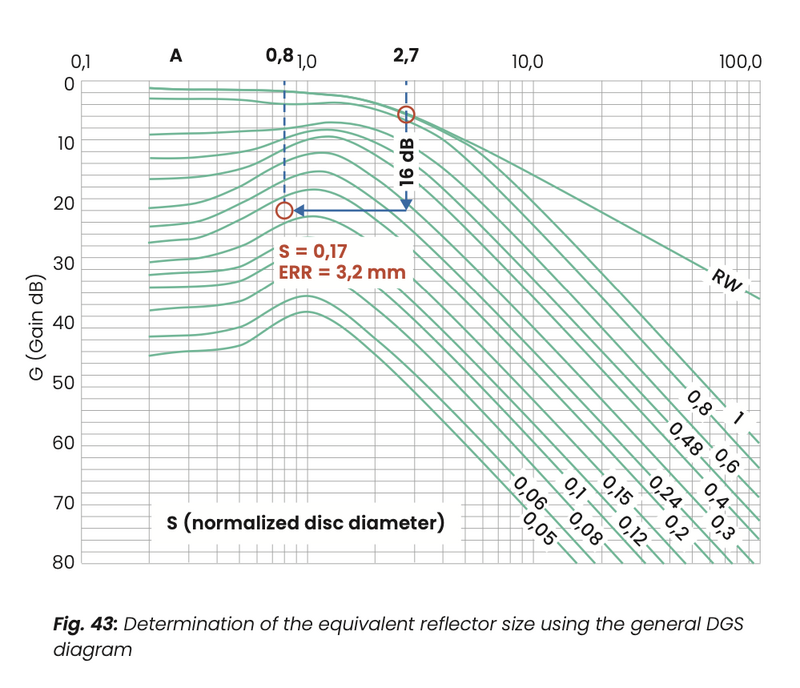
An example of the use of the DGS diagram is given in the following table. An arbitrary back wall echo is used as the reference echo, which is set to a specific reference height of the screen of the instrument. Normalise the distance zW of the back wall to Zw and find the corresponding point on the back wall echo curve (fig. 43) in the DGS- diagram. The gain required to set the back wall echo to the reference height is VW.
Prerequisite
Target
Actual
fs = 4 MHz
fi = 3,9 MHz
cs = 5,92 km/s
ci = 5,9 km/s
Ds = 20 mm
Di = 19 mm
Ns = 68 mm
Ni = 61 mm
Measurement
zW = 165 mm (distance to backwall)
VW = 46 dB
zR = 49 mm
(distance to reflector)
VR = 62 dB
Evaluation
ZW = zW/Ni = 165/61 = 2,7 (normalized distance)
ZR = zR/Ni = 49/61 = 0,8 (normalized distance)
∆V = VR – VW = 16 dB
With ZR and ∆V follows acc. to fig. 43: G = 0,17
→ d = G∙Di = 0,17∙19 mm ≈ 3,2 mm (ERS of the reflector searched for)
The reflector appears at distance zR, which is to be normalized to ZR. For measuring the difference in amplitude between the reflector echo and the backwall echo the reflector echo is brought to the previously selected reference level. The gain necessary to do this could be VR. The amplitude of the reflector echo is then less by ∆V = VR – VW than the amplitude of the backwall echo. With the reflector distance ZR and the difference in amplitude one can determine the relative equivalent reflector diameter 0.17. When multiplied by the effective transducer diameter Di the result is the diameter of the reflector being looked for which is ERS = 3.2 mm.
The normalizing of distances and equivalent reflector sizes is naturally not necessary with special DGS diagrams and scales. If the probe however deviates too far from its nominal data (specifications) the special diagrams and scales may no longer be used whereas the general diagrams can always be used with the actual data, fig. 43.
In the current example it is assumed that the material does not have any attenuation worth mentioning. This must be checked before measurements are made. If the sound attenuation cannot be ignored the following corrections are necessary, with a given attenuation coefficient 𝛋 (dB/m):
VW' = Vw - 2𝛋 ∙ zW and
VR' = VR - 2𝛋 ∙ zR
With these quantities VW’ and VR' one proceeds as with VW and VR. Modern digital ultrasonic flaw detectorsuse special DGS programs to evaluate echoes of discontinuities. The necessary real parameters of the probe are keyed in using the menu or with dialogue probes are read automatically by the digital Instrument itself. Necessary DGS- curves are displayed directly on the digital screen. Calculations are executed by the digital instrument, the results are displayed on the screen, too.
This means that the use of DGS diagrams and DGS scales has been a thing of the past since the intro- duction of digital ultrasonic testing devices.
In Summary
The evaluation of echo amplitudes using equivalent reflectors, particularly in the form of disc-shaped substitutes, provides a clear and reproducible approach to ultrasonic flaw detection. By leveraging tools such as DGS diagrams and scales—whether traditional or digital—technicians can accurately determine the size and significance of internal reflectors within a test material. While digital instruments now handle much of the heavy lifting, understanding the foundational principles of echo evaluation remains essential to ensuring accurate and reliable testing results across a wide range of applications