How do I draw an exposure chart?
In this article:
- Exposure Charts Are Plotted on Log-Linear Graph Paper: Material thickness (in mm) is plotted on the horizontal linear axis, while exposure values (in mA·min) are plotted on the vertical logarithmic axis to visualize radiographic exposure relationships
- Data Points Are Derived from Preliminary Charts: Using intermediate charts—such as density-thickness and kV-thickness curves—radiographers identify exposure values that yield a target film density (e.g., D = 2) at specific material thicknesses
- Each kV Setting Produces a Unique Line: For a given tube voltage (e.g., 150 kV), two or more exposure-thickness pairs are plotted and connected with a straight line. Repeating this for multiple kV values builds the full exposure chart
- Step Wedges and Flat Plates Provide Empirical Data: Radiographs of step wedges and flat plates at various voltages and exposure times are used to measure film density and generate accurate plotting points
- Final Charts Enable Fast, Accurate Exposure Planning: Once complete, the exposure chart allows radiographers to quickly determine the correct exposure time for any material thickness and voltage combination, improving efficiency and consistency
How do I draw an exposure chart?
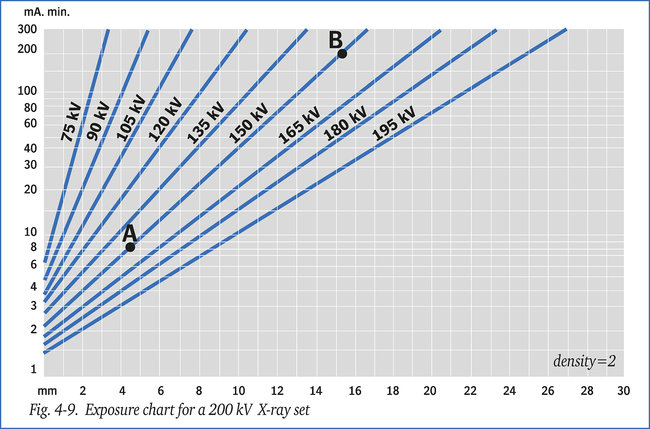
The exposure chart should be drawn on uni-directional logarithmic paper. The material thickness (in mm) is plotted on the horizontal linear axis and the exposure value (in mA.min) on the vertical logarithmic axis. For a given kilovoltage (for example 150 kV), we can, using the previously described intermediate kV-thickness chart, determine that for an exposure dose of 8 mA.min a density of 2 can be obtained at a thickness of 4.5 mm and for an exposure dose of 200 mA.min, at a thickness of 15.2 mm.
These thicknesses, and the corresponding exposures, are then plotted on the graph paper to give points A and B, see figure 4-9. Drawing a straight line linking points A and B, the 150 kV line is obtained. In a similar way the lines for other kV-values can be drawn in the diagram, eventually resulting in the complete exposure chart of figure 4-9.