
How do I produce an exposure chart for X-rays?
In this article:
- Step Wedges Are Essential for X-ray Exposure Charts: The article explains how to use step wedges or flat plates of varying thicknesses to simulate material density and generate accurate exposure data for radiographic testing
- Preliminary Charts Guide Final Exposure Settings: Two key preliminary charts—density-thickness and kV-thickness—are created using controlled exposures to map how material thickness and voltage affect image density
- Standardized Radiographic Parameters Ensure Accuracy: The process uses consistent X-ray settings (60–200 kV, 5–10 mA), no filters, and specific film types (e.g., D7) to ensure reproducibility and reliability in industrial radiography
- Densitometer Readings Enable Data-Driven Calibration: After film development, a densitometer measures grayscale density across the step wedge, providing the data needed to plot exposure curves
- Final Exposure Chart Optimizes Radiographic Quality: By combining intermediate curves from different exposure levels, a final exposure chart is created to ensure optimal image quality and defect detection across varying material thicknesses
How do I produce an exposure chart for X-rays?
The step wedge
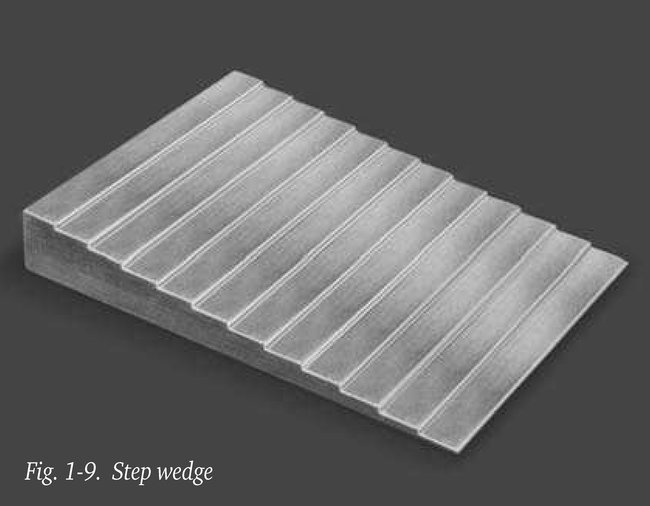
The production of an exposure chart calls for either a large step wedge or a series of plates of different thicknesses made from the same material to which the chart relates. The increase in thickness between each consecutive step is constant, but varies for different materials from 0.5mm to several millimetres.
For examinations using a tube voltage of less than 175 kV the thickness of the wedge might increase by 0.5 or 1.0 mm at each step, while for radiographs using a higher tube voltage the increase could be in the order of 2-3 mm. In addition several flat plates made from the same material and of a specified thickness (e.g. 10 mm) should be available. If the thickness range of a step wedge runs from, say, 0.5 to 10 mm, the step wedge and flat plate together would give a thickness range of 10.5 – 20 mm.
Preliminary charts
Before producing an exposure chart it is useful to first draw up preliminary charts, the so-called “density-thickness chart” for the voltage range of the specific X-ray set and a “kV- thickness chart”.
The two preliminary charts are produced on the basis of the following data:
- X-ray set: tube voltage 60-200 kV, tube current 5-10 mA
- Filter: none
- Source-to-film distance: 80 cm
- Material: steel
- Intensifying screens: none
- Type of film: D7
- Density: 2.0
- Development: automatic, 8 minutes at 28°C in G135 developer
Exposures
Using a tube current of say 8 mA and an exposure time of 1 minute (i.e. 8 mA.min) radiographs of the step wedge are made at voltages of, for example 75, 90, 105, 120, 135, 150, 165, 180 and 195 kV. Only a narrow strip of the film is used for each exposure. The same process is repeated at, say 10 mA with an exposure of 20 minutes (i.e. 200 mA.min).
Measuring the density
After development of the radiographs, the density of all steps is measured by a densitometer, see section 9.2.
Drawing up the preliminary charts
The densities measured are plotted graphically against the material thickness for which they were obtained. A smoothly curved line then joins the points relating to one particular voltage. The result is two preliminary charts (figure 2-9), made at 8 mA.min and 200 mA.min.
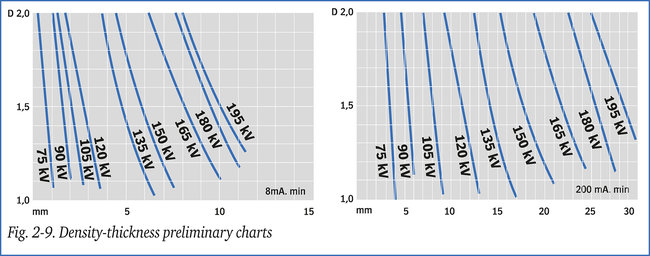
The “density-thickness (preliminary) charts” as described, provide the data needed to prepare the final exposure chart. In order to eliminate any inaccuracies, an intermediate chart (based on the preliminary charts) is prepared for density 2, using the data already recorded in the first charts.
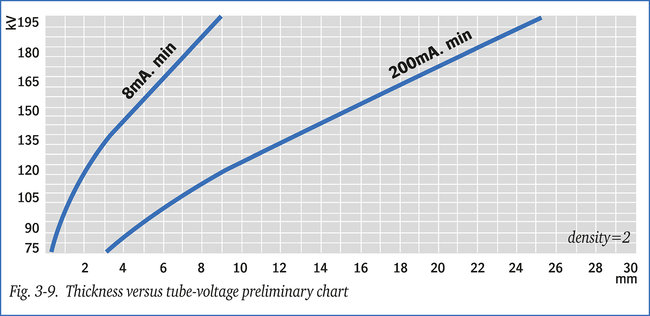
This is how the “thickness-tube voltage chart” of figure 3-9 is arrived at. Points relating to the same series of exposures are then joined in a smooth line producing the intermediate curves for 8 mA.min and 200 mA.min. In this way deviations in the results of any of the radiographs can be compensated for.