

How do I evaluate reflectors by using the echo amplitude?
In this article:
- Echo Amplitude Evaluation Relies on Equivalent Reflectors: Since natural reflectors in materials produce complex and inconsistent echoes, ultrasonic testing uses standardized disc-shaped equivalent reflectors to interpret signal amplitudes reliably.
- Disc-Shaped Reflectors Provide a Consistent Reference Model: These reflectors simulate the echo response of small flaws and allow for reproducible amplitude measurements, especially when aligned with the acoustic axis of the sound beam.
- Echo Amplitude Depends on Distance and Reflector Size: In the far field, echo strength decreases with the square of the distance and increases with the square of the reflector diameter, forming the basis for Distance-Gain-Size (DGS) analysis.
- DGS Diagrams Standardize Flaw Sizing Across Materials and Probes: These diagrams normalize reflector size and distance, enabling inspectors to compare echo amplitudes and estimate flaw dimensions across different ultrasonic setups.
- Manual vs. Automated Testing Requires Different Evaluation Approaches: While manual testing ensures alignment with the acoustic axis, automated systems must account for off-axis reflectors, requiring more advanced modeling and interpretation.
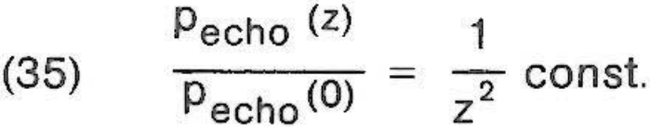
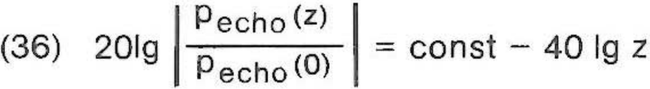
Due to the fact that the many reflection conditions, existing at the natural reflector in a material, can never be clearly interpreted by ultrasonic means, one has resorted to a substitute — the equivalent reflector! With the equivalent reflector the echo from a discontinuity can be traced to a clear source (substitute) independently of the operator. Such a substitute source is e. g. a discshaped reflector which, if lying perpendicularly on the acoustical axis of the sound beam, would deliver the same signal amplitude as the unknown natural reflector. This correlation is allowable as long as the natural reflector is one whose characteristics are similar to that of a circular surface. 1hat is the case for all discontinuities which represent "small reflectors" i. e. reflectors which do not extend beyond the limits of the sound beam in any direction. A behaviour characteristic similar to a circular disc is still present with an oblong reflector. The pre-requirement that the reflector lies on the axis of the sound beam, is fulfilled for the manual test. There the probe is moved until the maximum indication is obtained from the reflector. Then the reflector lies on the acoustical axis. With the automatic test with fixed test paths lt is pure chance that a reflector lies on the acoustical axis of the sound beam. Here one may not simply operate with the disc-shaped equivalent reflector ( equivalent reflector size = diameter of the disc) according to the signal amplitude (see chapter 13). The model of the disc-shaped reflector has the advantage that lt can be easily experimented with and also be used for theoretical solutions. lt is simple to note the distance laws in the far field for discshaped reflectors in single probe Operation: If the distance between the probe and the reflector is increased the pressure of the approaching sound pulse decreases in proportion to the distance (chapter 8). The reflected sound pulse also loses pressure up to the receiver in proportion to the distance z, i. e. the echo amplitude is a function of the square of the distance z.
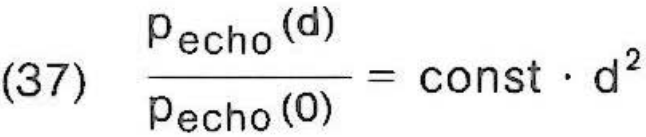
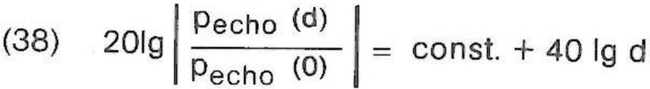
As the sound pressure of the reflected pulse is a function of the surface area of the reflector, which is the square of the diameter d, the echo amplitude in the far field is proportional to the square of the diameter (37).
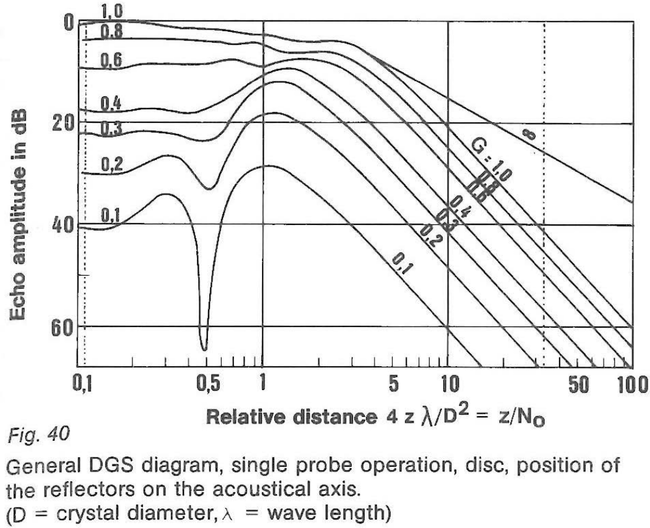
This generally applicable relationship between disc-shaped crystals (transducers) and discshaped reflectors depending upon the distance (D), gain (G) and size (S) is given in the DGS diagram (fig. 40). To obtain a general applicability the size of the reflector ist normelised by (39)
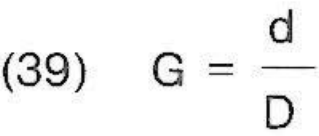
(reflector diameter/transducer diameter)
The distance z as (40)
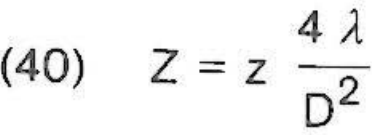
(distance in near field lengths)
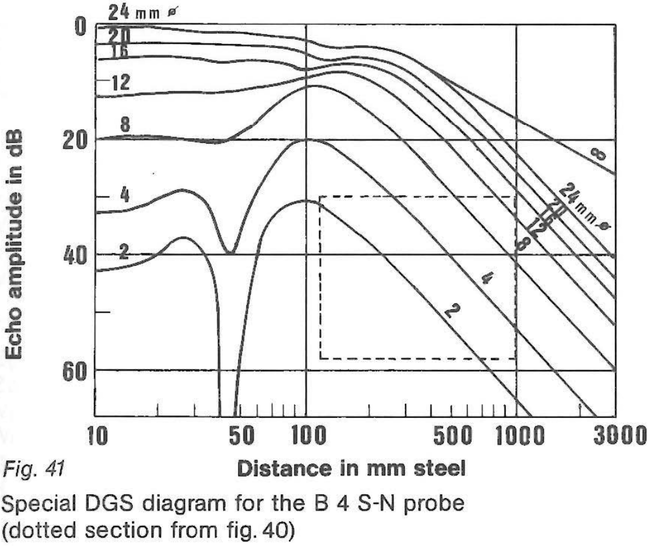
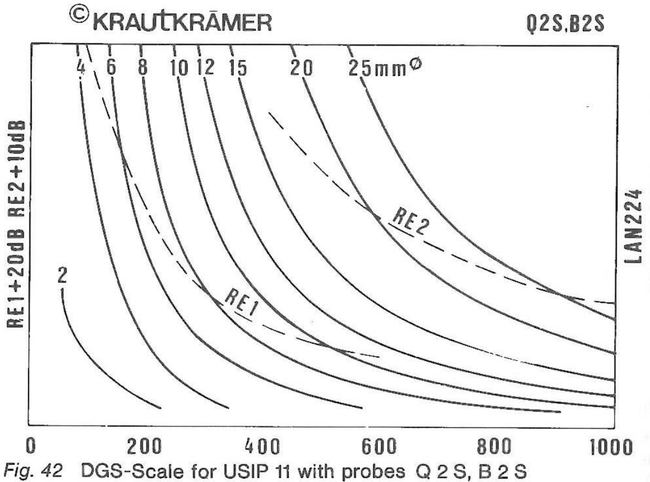
In order to save the converting of normalized values into absolute values one can make special DGS-diagrams for certain probes and materials as e. g. in the Krautkrämer Probe Data Sheets (such special diagrams apply for one probe and one type of material only). They represent a section of the general diagram (fig. 41). Even more simple is the test with a DGS scale which does away with any "writing work". The scale represents a small section from a special DGS-diagram. The equivalent reflector curves are not in double logarithmic scale but are in double linear scale (fig. 42).
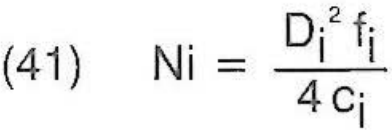
Naturally DGS-diagrams cannot only be compiled for disc-shaped transducers and reflectors. They can be also produced for rectangular or cylindrical reflectors. DGS-diagrams are not limited to single probe operation. There are designs for TR-probes (fig. 12) and for tandem Operation using two probes (fig. 36). Before using a DGS-diagram or scale the effective data (actual data) of the probe must be known: diameter Dl and near field length Ni
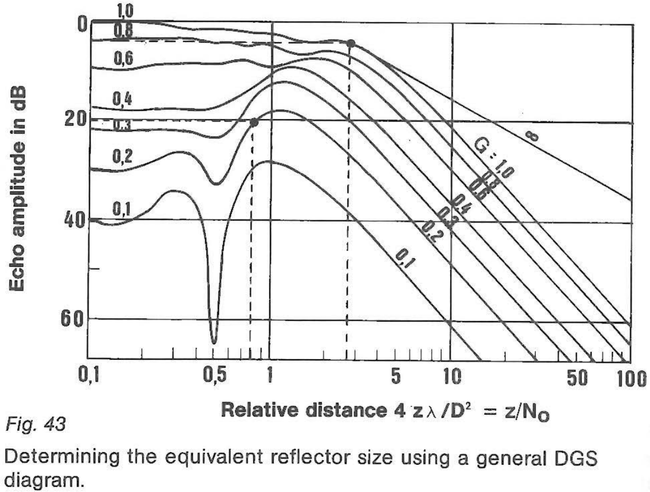
An example for the use of the DGS-diagram is given in the following table. Any optional backwall echo is used as a reference echo and is set to a specific reference height on the CRT scale. One normalizes the distance zW of the wall to ZW and finds the relative point on the backwall echo curve (fig. 43). The gain necessary for adjusting the backwall echo be VW.
Previously given
nominal real
fs = 4 MHz fi = 3,90 MHz
cs = 5,920 km/s ci = 5,900km/s
Ds = 20 mm Di = 19,0 mm
Ns = D2 . f/4. c Ni = 61 mm
Measured values
zW = 165 mm (distance of the back wall)
Vw = 46 dB
zR = 49 mm
VR = 62 dB
zW = zW/Ni = 165/61 = 2,7
zR = zR/Ni = 49/61 = 0,8
VR - Vw = 62 dB - 46 dB = 16 dB
With Zr and VR - Vw is according to Fig. 43
G = 0,2
d = G Di = 0,2 * 19 mm = 3,8 mm (diameter of the refelector)
The reflector appears at distance zR, which is to be normarized to ZR. For measuring the difference in amplitude between the reflector echo and the backwall echo the reflector echo is brought to the selected reference level. The gain necessary to do this could be VR. The amplitude of the reflector echo is then less by VR - VW than the amplitude of the backwall echo. With the reflector distance ZR and the difference in amplitude one can determine the relative equivalent reflector diameter 0.2. When multiplied by the effective transducer diameter Di the result is the diameter of the reflector being looked for which is 3.8 mm . The normalizing of distances and equivalent reflector sizes is naturally not necessary with special DGS diagrams and scales. If the probe however deviates too far from its nominal data (specifications) the special diagrams and scales may na longer be used whereas the general diagrams can always be used with the actual data. In the current example lt is assumed that the material does not have any attenuation worth mentioning. This must be checked before measurements are made. If the sound attenuation cannot be ignored the following corrections are necessary:
attenuation coefficient [?, ( dB/m) = VW - 2 ß • zw VR' = VR - 2 ß • ZR With these quantities VW' and VR one proceeds as with VW and VR.
Modern digital ultrasonic flaw detectors use special DGSprograms to evaluate echos of discontinuities. The necessary real parameters cl the probe are keyed in using the menu or - with dialogue probes - are read automatically by the digital Instrument itself. Necessary DGS-curves are displayed directly on the digital screen. Calculations are executed by the digital instrument, the results are displayed an the screen, too.