
How do I use an exposure chart?
In this article:
- Exposure Charts Streamline Radiographic Setup: Exposure charts provide pre-calculated values for selecting optimal exposure times, reducing trial-and-error and ensuring consistent image quality across inspections
- Each X-ray System Requires a Custom Chart: Due to variations in equipment—such as tube type, voltage, and even cable length—individual exposure charts should be created for each X-ray unit to ensure accuracy
- Charts Help Select the Right Working Method: By referencing material thickness, radiation energy, and desired film density, exposure charts guide radiographers in choosing the most efficient and effective inspection parameters
- Gamma-Ray Charts Are Simpler Due to Fixed Spectra: Unlike X-ray tubes, gamma sources like Iridium-192 and Cobalt-60 have fixed energy levels, allowing for standardized exposure charts or slide-rule calculators
- Using Exposure Charts Saves Time and Resources: Implementing exposure charts minimizes the need for test exposures, improves workflow efficiency, and enhances radiographic reliability in both routine and non-standard applications
How do I use an exposure chart?
While it may be possible to gradually build up a store of information which can be consulted in day-to-day work, it is better to make use of good exposure charts. This system has many advantages to offer, particularly when it comes to choosing the most suitable working method. Apart from saving time, it gives a guarantee of efficiency and moreover does away with, or reduces to an acceptable extent, the need for trial exposures on jobs which are a little outside the normal routine.
Different X-ray tubes can in practice give quite different results, even though they may be of the same type. Even a different cable length between the control panel and the tube may be of influence. Therefore, an exposure chart for each individual X-ray set should be drawn up. This is an excellent way to become familiar with the equipment, while time and money put into this work will be amply repaid at a later stage.
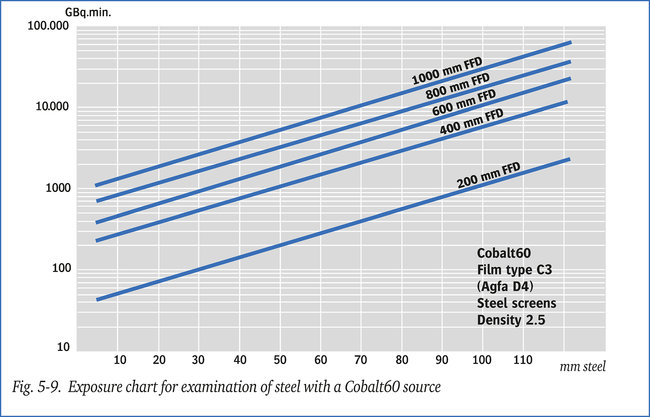
Exposure charts for gamma-ray examination are drawn up in a similar way as described above.
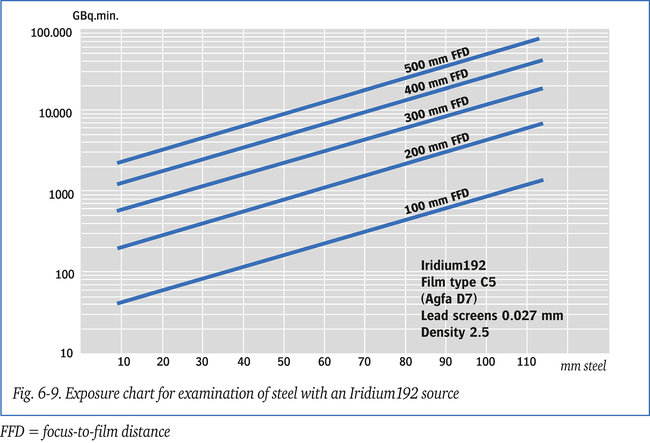
Figure 5-9 shows one for a Cobalt60 source. A specially designed slide-rule can also be used, since there is no need to consider individual radiation spectra as for X-ray tubes. Figure 6-9 shows a similar exposure chart for an Iridium192 source.